It is important that you understand why most of the MIPS models have recently (last 2 months) been issuing many more trade signals than they would under "normal" times. [And, no... there is nothing happening that the MIPS models cannot handle, as has been the case with many other models in 2018.]
Remember, between the twelve years of 2007-2018, the MIPS3, MIPS4, and MIPS/Nitro models have traded an average of 12-15 trades/year; with some years trading 4-5 times and others trading 15-20 times.
The MIPS models are known for being able to avoid getting whipsawed in flat/sideways markets that can last 10-15 months. Our models do this mainly by either keeping the position that it had going into the flat market (long, short, or cash) or simply by going to cash often. That is mainly why the MIPS models traded only twice in the first 10 months of 2018. From the graph below, in these 10 months, you will see some "wobbling" in the 1st quarter (where MIPS only traded twice) and then a rather strong "Short-Term" trend line (brown line in graph) from the end of March to the middle of September (where MIPS stayed Long). So, during this time, the MIPS models were mostly Long, and traded only twice.
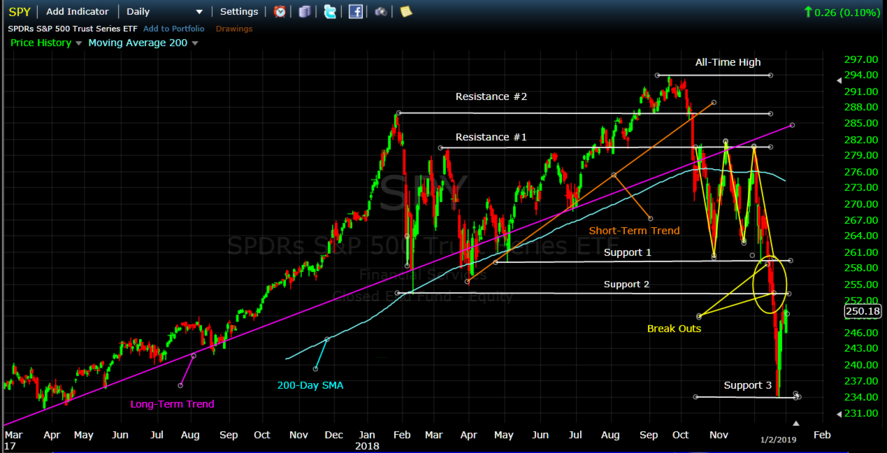
However, from the middle of October to the middle of December, the SPY went sideways again in something like a pattern-within-a-pattern (see the yellow trend lines between Resistance 1 and Support 1 forming a "W" Pattern). After the SPY broke out of the bottom of this pattern, as is the case most of the time after a market "breaks out" of a flat pattern, all hell breaks loose and high volatility becomes the norm. [See yellow "Break-Outs" to the downside near the bottom right in the graph below.]
This is where MIPS (and most other quantitative models) have their most trouble. In situations like this, MIPS goes into a "kind of" defensive mode, and seeks to limit losses. When there is any doubt of a sustained market direction, MIPS may simply go to Cash. And, to avoid getting whipsawed, the MIPS models internally build a "no-man-zone" around a potential trigger point. And, instead of the MIPS trade signals going from say Long-to-Short, the models will go to Cash in the "no-man-zone", with the result being trades like Long-to-Cash-to-Short (instead of just Long-to-Short). Of course, the same thing happens on potential Short-to-Long trades.
FYI- The MIPS models issued 10 trades in 2018, two in the first quarter and eight in the 4th quarter. This is not the norm as the modes trade as the trend trades (or to limit losses).
With these type of tactics built in, the MIPS models managed to provide gains of 1-3% in 2018, depending on the model; whereas the SPY benchmark lost around 6.5%.
While some models did better, other well-known and well-respected models lost between 6-15% for the year.
BTW, the drop from the top in September to the bottom in December was about 20%, and some people had to drink with that on New Year's Eve !!!
Happy New Year !!!
Paul Disetefano, PhD
CEO / Founder
MIPS Timing Systems, LLC
Houston, TX
281-251-MIPS(6477)
www.mipstiming.com
Support@mipstiming.com


