Well, well, well... The market (S&P 500) hit another new high this week. The reason "given" for this by the press is that the economy continues to improve as indicated from the jobs report this week (showed more jobs created than expected). Of course, "the press" will release any news (or any reason behind it) that flies, if people fall for it (true or not).
See the graph immediately below and continue reading below that....
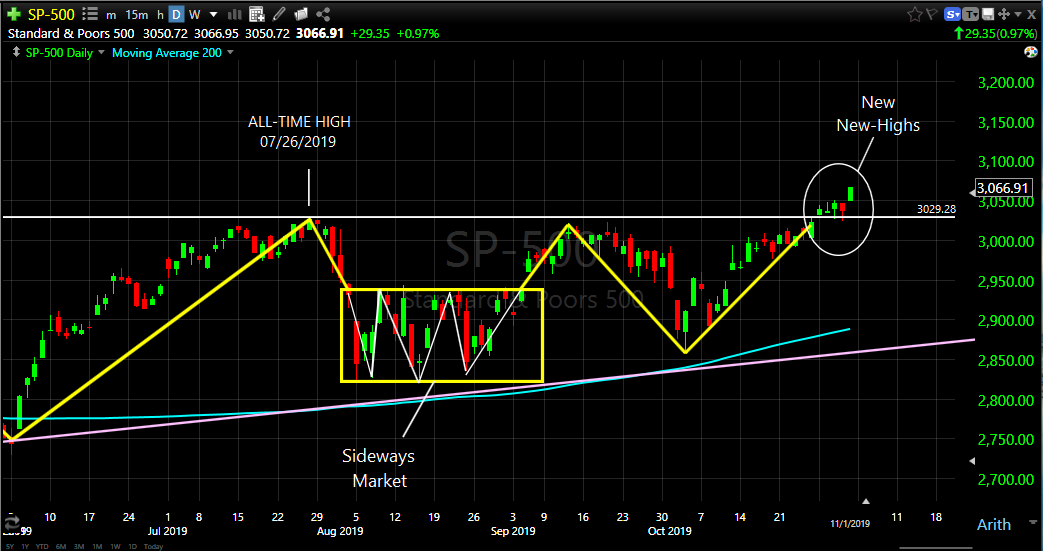
As you can see in the graph above, from a quantitative view two things are possible:
I.) A market top is showing itself in the form of a "Triple Top", or
II.) More new-highs are expected as indicated by the "upside breakout" after the 3rd try in the
last 3 months.
EXPLANATIONS
I.) The "triple top" is sometimes one of the best indicators showing a market that is getting ready to turn around and head south. It seems to me that this is not the case now, although there could be arguments regarding overbought stocks, high P/E ratios, etc. But, it is not because (as the press is pushing) the "time has come" for the market to let out steam (aka "crash").
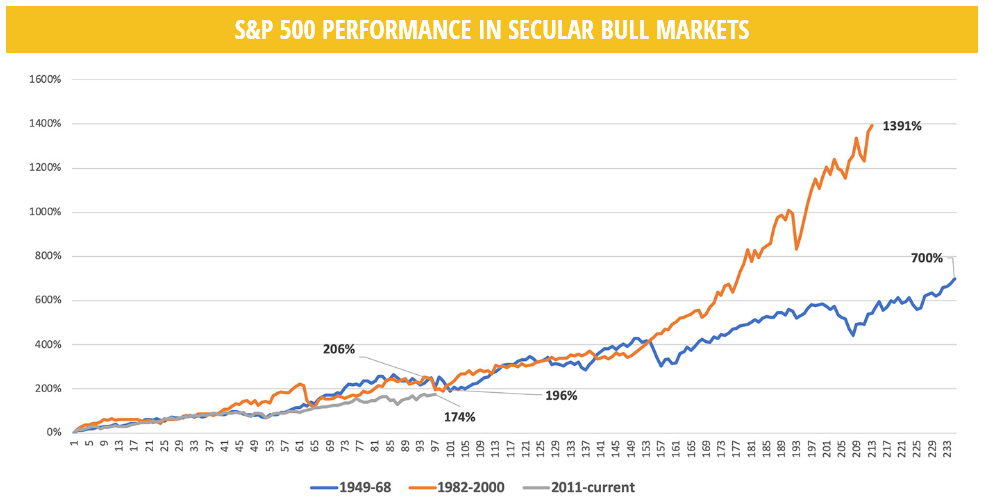
II.) Regarding the last sentence above, we do not believe that the "time has come" for the market to take a big drop. The press should look to find other reasons because there have been several other almost 20 year "runs" in the stock market since 1950, thus having lasted about TWICE as long as the "run" that we are in now. In the graph below (from Proactive Advisor magazine), you can see that "Bull Runs" have lasted 19 years in "1949-1968" (orange line) and 18 years in "1982-2000" (blue line). You can also see that after 8 years in this bull market of "2011-current" (gray line), the up-trend has been in existence for about 100 months, but it still has plenty of time to grow without having to break any "time" records.
Ok, ok... Good cases for both of the above, so "what's next"?
The "what's next" is out of my personal ability (and yours). But, I have programmed the MIPS models with sophisticated mathematics to tell us what to do, and you and I personally are not going to beat that. In fact, MIPS3 is the top model on TimerTrac.com (#1 tracking company) for performance between 2007-2019 ytd. MIPS follows the S&P 500 index (to buy or sell) kind of like the software in a F-35 fighter jet follows an enemy fighter jet (to live or die). BTW, you step into that type of arena every time you travel on a commercial aircraft (autopilot), drive a car, etc.
So, follow MIPS in the future !!!
Good trading !!!
Paul Distefano, PhD
MIPS Timing Systems, LLC
Houston, TX
281-251-MIPS(6477)
408-234-8348 (Cell)


