Tuesday, November 06 2012
There is a lot going on in the world these days, the most important of which is tonight's election. There are many possibilities that will follow who wins the election, but that is outside of the scope of the MIPS "commentary" emails.
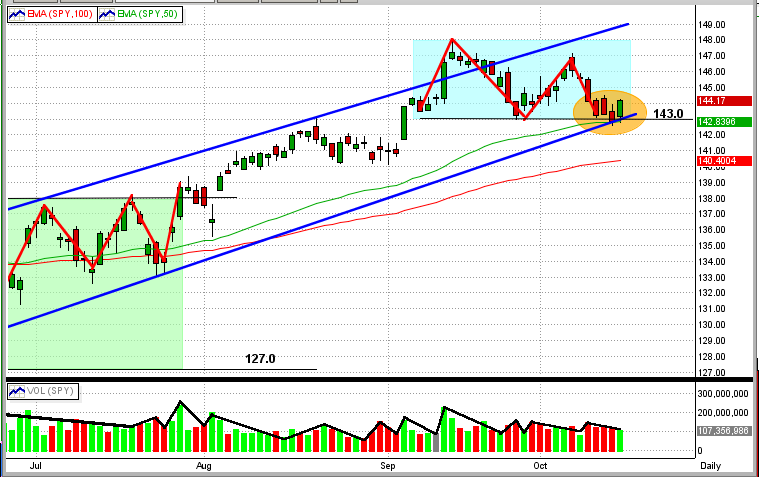
However, there is one point that we would like to make regarding recent market action. For the last eight days, the market has traded in what we would call "No-Man's-Land" (see graph below). In the last 8-day period (orange box), the SPY has closed between its 50-day EMA on the upside (green line) and its 100-day EMA on the downside (red line). Last Friday, the SPY opened above its 50-day EMA, but fell back into this trading range by the close. Today, however, the SPY closed decisively above its 50-day EMA.
So, the question is: "Does this breakout of the recent trading range mean there is more upside coming or is it just another so-called "bull trap", which sucks the bulls back into long positions only to turn right back to the downside. Of course, no one really knows the answer to this (not enough info), and we will just have to wait and see.
Or, does MIPS see this breakout as a new "Inflection Point" (from down-to-up) ? The answer is "not yet", so again we will just have to wait for MIPS to tell us what to do next, and when.
Friday, October 26 2012
The market has fallen to another critical level.
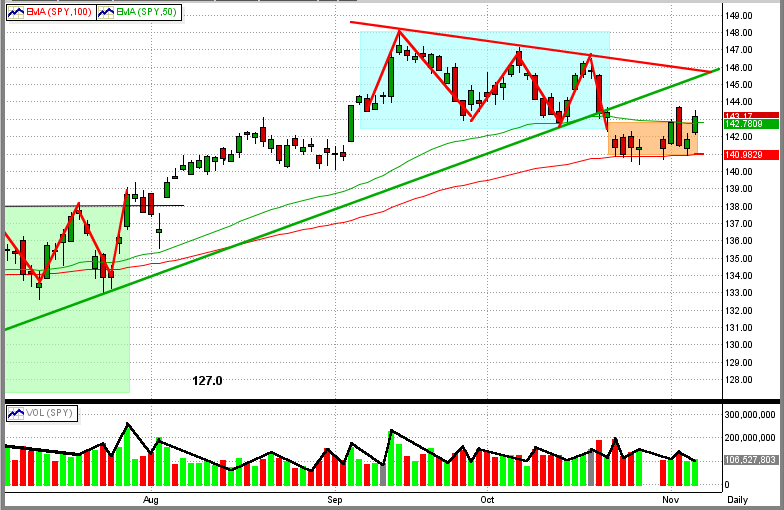
After falling about 4% in four trading days, the SPY has spent the last three days traveling along the "100-day EMA road" for the last three days (see Graph #1 immediately below). This is a critical point in the market because:
1) to get there, the SPY had to break resistance at $143.8 and 142.0 (i.e., the revered 1420 in the S&P 500).
2) the SPY is right on the very top of its 100-day EMA (red line),
3) we have seen bad 3rd quarter profit/outlook from some of the most stable companies in the counrty,
4) with bad profit and outlook numbers from tech leaders (Amazon, Apple, etc) after hours on Thursday, the
futures are down so we can expect a lower opening on Friday,
5) with any more bad economic/earnings data in the US, or bad news from Europe or China, this downdraft
could pick up steam quickly, and
6) these are very turbulent times and conditions/sentiment can change quickly.
All of the MIPS models (except the very low frequency MIPS1/VLF model) are short at this time. To get a better feeling of how MIPS "sees" the strength (or weakness) of this market, take a look at Graph #2 below.
Graph #1
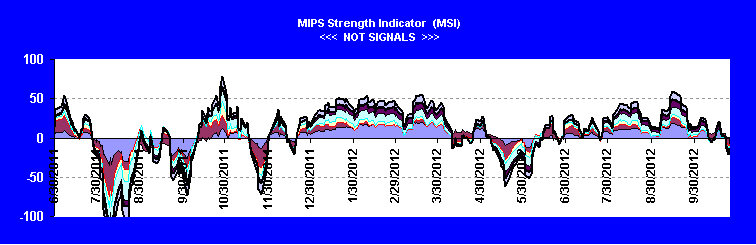
Graph #2
This graph shows the MIPS Strength Indicator (MSI) for the SPY. The MSI is a measure of the "strengh" of the market
trend as determined by the leading indicators in our MIPS models. You can see this graph about 1/3 down on the homepage of our website. The MSI graph is updated on our website at least once a week. CAUTION: The MSI is a measure of the strength of the market, but is NOT to be seen as or used as a "signal" indicator !!!
Monday, October 15 2012
It looks like we dodged a bullet today. From our last look at the SPY price/volume chart in our previous email, it looked as though we could be about to experience a serious downdraft. But, MIPS kept us LONG, and we are glad it did.
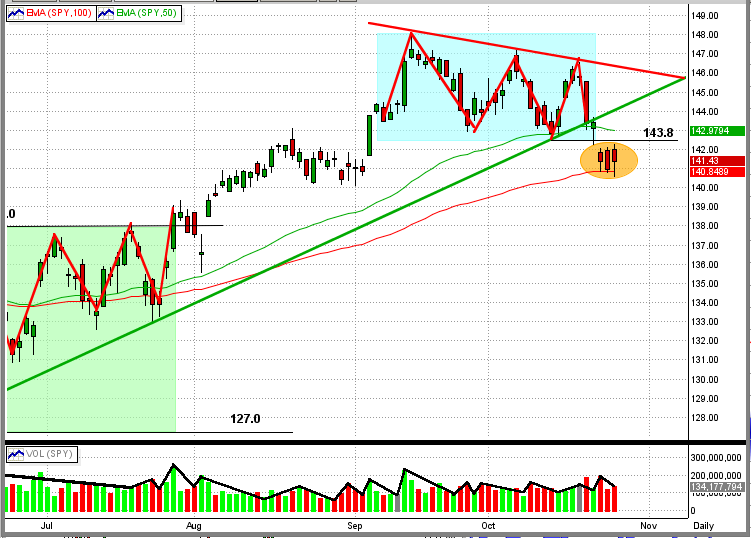
Today, the SPY hit a very critical downside price point and bounced back to the upside (see graph below).
At a price of $143 per share (black line), the SPY encountered the following resistance levels:
1) the 50-day EMA (green line),
2) the intermediate term trendline (blue line), and
3) the bottom of its six weeks trading range (cyan box).
Needless to say, it did not breach any of these resistance levels (which should prove to be very positive).
Saturday, August 04 2012
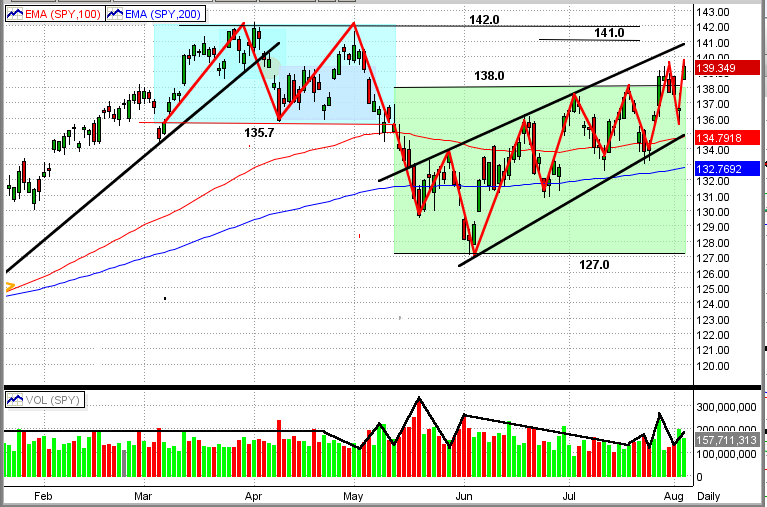
As suggested in our previous post, the market appears to be in a slow growing up-trend.
See the new graph immediately below. From this, you can see that:
1) The SPY has broken out of its prior trading range (green rectangle) to the up-side
2) The up-channel is readily apparent (black lines)
3) Since mid-year, the market is moving with precision to higher-highs and higher-lows
4) The SPY is above both of its 100-day and 200-day EMAs
5) In the last two swings, the SPY volume has been increasing in up markets and dropping in down markets
Let's enjoy this up-trend while it lasts. We expect a high level of upside resistance for the SPY between $141-142/share.
- if the SPY breaks this resistance to the upside, its next big resistance levels are between about $145-150/share
- at this time, we are about 13% below the 2000 and 2007 highs (approx. $157/share)
- this would be a good goal to attain, but it would also make an ideal point for the big guys to start selling big time.
If, or when, the market turns down (as it probably should), MIPS will get us to a cash or short position in ample time.
Monday, July 16 2012
Two weeks ago (7/2/12) we posted the below entitled "MIPS - Yet Another Trading Range or A New Up-Channel ???"
- the question was basically what kind of "pattern" the market was trading in?
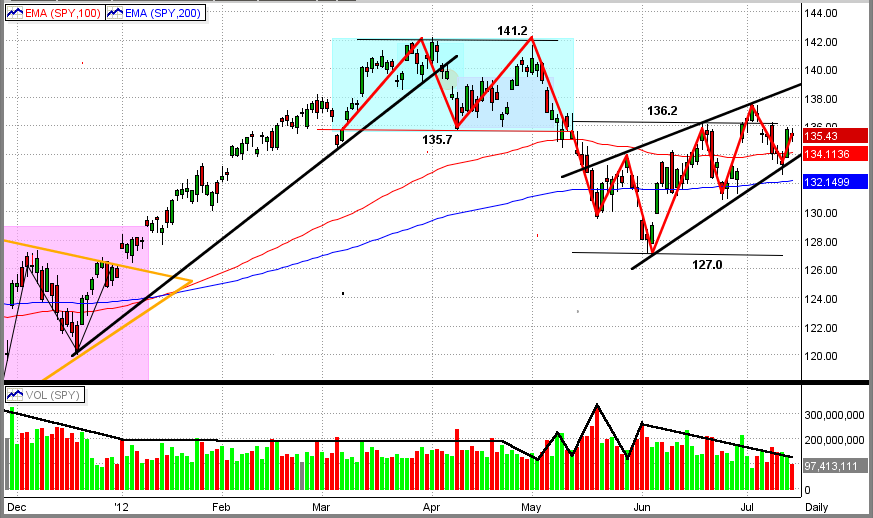
Since then, the market seemed to have answered that question (see the graph immediately below). With higher highs and higher lows over the last 8-9 weeks, the market seems to be in a new "up-channel". If the SPY breaks above $136.20/share in the next few days, the next upside resistance levels will be at about $139, and then at $142/share (about +5% above today's close). It is a little bothersome that the trading volume is still declining when the market is rising. That tells me that it is NOT the big guys that are pushing the market up at this time. But, the little guys still have lots of buying power on the sidelines (i.e., money that is NOT in equities).
As of today's date, all MIPS models are Long (see Current Signals under the "Signals" tab on our homepage). MIPS will guide us in the right direction over time.
<<< Previous post - 7/2/12 >>>
|
As you look at the two graphs below, you will see either of:
1) Another Trading Range as in Chart #1, or
2) A New Up-Channel as in Chart #2.
Chart #1 - Another trading range, with up-side resistance at 136.2 and downside support at 127.0
- If the SPY breaks thru 136.2 to the upside, we should have a rally
- But, if the SPY fails to break up above 136.2 over the next few days, the SPY will most likely
fall back to 127.0
Chart #1

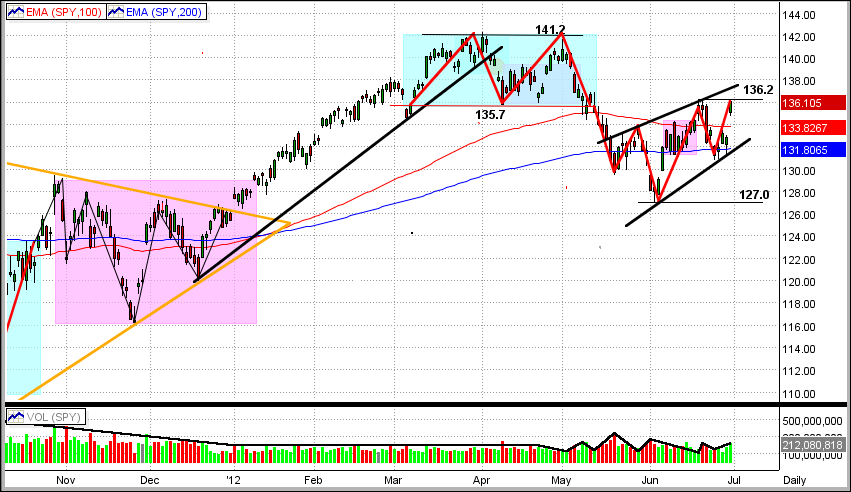
Chart #2 - An Up-Channel, with higher highs and higher lows
- This market is definitely trending up, so the question really is: "Is this truly a new up-channel?"
- The SPY has been bouncing between 127 and 136 for all of 2012, so it's time the market finds a new trend
- The chart below seems to be indicating that its new direction will be up, but it could easily continue sideways
- So, let's let MIPS tell us what to do and when.
Chart #2
|
Wednesday, June 06 2012
Well, can we now answer the question from our previous email, "Is This a Correction or a Bear Trap" ?
- When we look at the last few days on the graph immediately below, it sure looks like the SPY will run up from here,
officially making the downside break on 6/1/12 a "Bear Trap".
- Not only did the SPY turn back to the upside, it kind of peeked its head above its 200-day EMA (blue line) and its
short-term trendline (black line).
- On the negative side, the volume during this very short-term "rally" has been weak and is declining as the market
moves up.
- The next strong resistance is the SPY 100-day EMA at $134 (red line)
However, none of the problems that sent the market down recently are even close to being "fixed". And, none of the MIPS models (except the very long-term MIPS1/VLF model) are convinced that the market action over the last few days constitutes a "new intermediate up-trend" yet, and they stand by their "Short" signals (at least for now).
And, of course, only time will tell which direction the market will move from here, but it should only take a short amount of time to do so. Needless to say, the next few days are critical.
Monday, June 04 2012
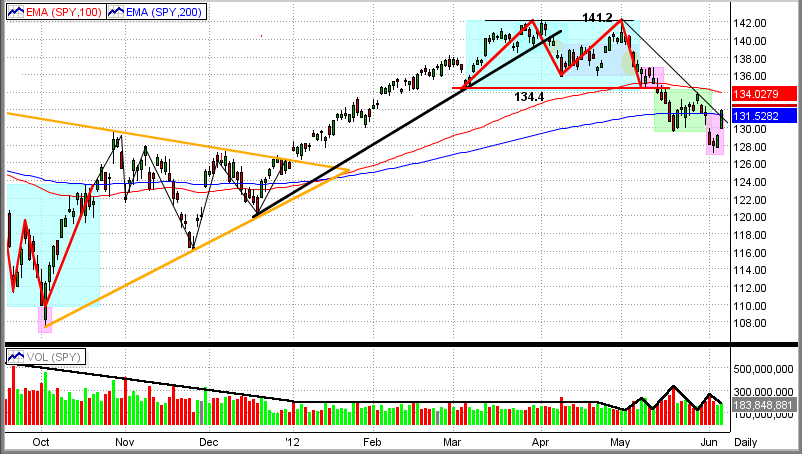
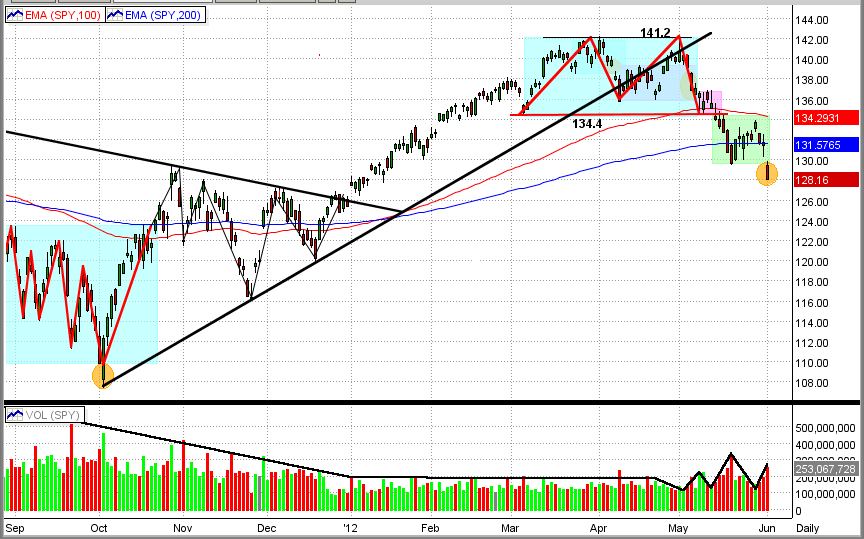
By all measures of technical analysis, the recent market action and volume (or lack thereof when the market moved up) would indicate a correction (or worse).
See the graph immediately below and scan the previous emails.
From the 1st graph, you will see that the SPY has:
- broken its most recent intermediate-term trendle,
- fallen below the neckline of a double-top pattern (blue box)
- fallen below both its 100-day EMA and 200-day EMA (red line and blue line)
- broken thru the bottom of its most recent trading pattern (green box)
And, the trading volume of the SPY has been decreasing in up moves and increasing in down moves.
That in itself is usually strong evidence of a market downdraft (correction or worse). Taken together with the terrible unemployment rate and very slow job creation in the US, the slowdown in the Chinese economy, and a possible meltdown in Europe, and it could become a recipe for disaster. That is what the graph below is trying to tell us.
But, it could also be displaying a Bear Trap signal. Look at the two drops in the SPY shown in the orange circles, one in early Oct'11 and the other on Friday of last week. On 10/04/12, the SPY's drop thru the bottom of a sideways trading pattern turned out to be a one-day key reversal, and this Bear Trap was followed by a 30% gain in the SPY.
So, could the SPY's drop on 6/01/12 possibly be a similar Bear Trap and be followed by another strong intermediate-term uptrend ? The market action in the next 2-3 days should be indicative of what the next major move in the market will be. [Keep in mind, however, that it would not be abnormal for the SPY to move up on Monday following its 2.5% drop on Friday (this has kind of been the norm in the last few years of high volatility).]
Whew, enough guessing. Let's follow MIPS and let it guide the way for us.
Sunday, May 27 2012
Many people ask us how can they beat the SPY in up markets when they are trading the SPY itself. That is, how in the heck do you beat the performance of the index fund that you are trading? Needless to say, you absolutely cannot do this with a buy and hold strategy.
Let's assume that you are using a timing system that tracks the SPY to determine up-trends and down-trends, and that this timing system is deadly accurate. Then if you are trading SPY, the only way that this system can beat the SPY in up markets is by being short when, and if, this up market contains some intermediate downdrafts during its ascent. See the graph immediately below.
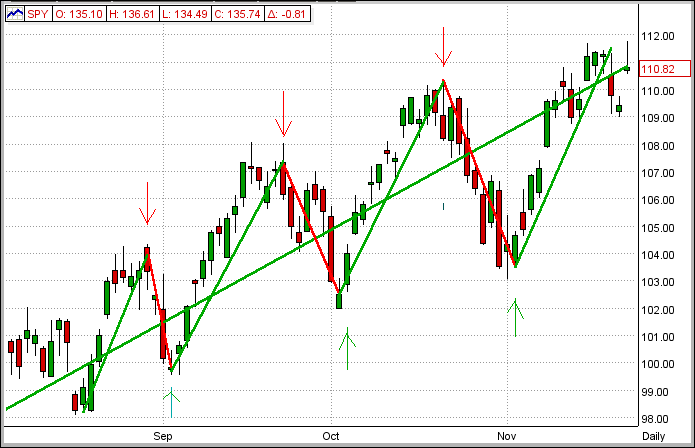
Now, if the market ascent has only small or relatively few downdrafts (as happens in many slow-growing up markets), the model will keep you long and you will simply follow the SPY upwards. So, if the SPY goes up 20% over some period of time, your money will also go up 20% in this period, but your performance will be equal to that of the SPY. In other words, even though you are making money in this market, your performance will be basically the same as that of the SPY.
[PS - This is not usually the case with fast-growing up markets since there is almost always enough volatility in these markets for MIPS to take advantage of some of its larger, inevitable downdrafts by being short.]
Of course, in down markets we don't have this problem because, when our timing model gets us into short positions in down markets, we not only make money, but our performance ratchets up as the market goes down. So, in a similar example as above, if the SPY goes down 20% in a certain period of time, since our timing model will have us short in this time period, our performance will be +20%. The net effect, of course, is that our performance would have been +20% when the SPY was -20%.
Ok, got it. But, the initial question has still not been answered.
"How Can We Beat the SPY in Up Markets"?
Independent of whether the market is going up or down (i.e., the SPY is going up or down), the simplest way to beat the SPY is to trade index funds that:
(a) correlate well with the SPY (i.e., changes direction at the same time), and
(b) have higher volatility than the SPY (goes up and down more than the SPY).
Although there are very many ETF and mutual fund indices that fit this criteria, we believe that the two best ETF candidates for this are the Russell 2000 (IWM) and the NASDAQ (QQQ).
Trading IWM and QQQ to Beat the SPY in Up Markets
- the following is a detailed analysis of this suggestion.
FIRST (the period of 2003-10)
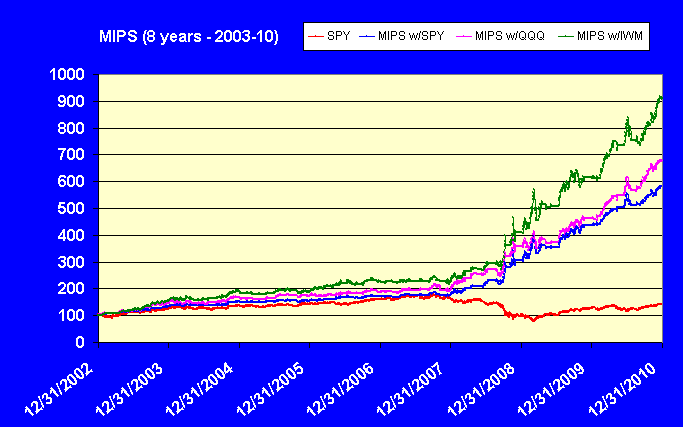
On our website (www.mipstiming.com), if you click the "Performance" tab on the main menu on our homepage, and then click the "Study VI" button on the top left of the Performance page, you will see the MIPS3/MF performance from trading the SPY, QQQ, and IWM relative to buy/hold SPY in the 8-year-period of 2003-10. To save time and effort, a copy of that page is shown immediately below.
From the table/graph below, you can see that:
1) trading the SPY with MIPS3/MF signals soundly beats buy/hold SPY over the entire time period
(+481% vs +43%),
2) trading the QQQ (+574%) and the IWM (+808%) with MIPS3 signals did much better than just trading the
SPY with MIPS3 signals.
As a consequence of this, I usually trade SPY, QQQ, IWM using MIPS3/MF signals with a mix of 1/3 of each or
1/2 SPY, 1/4 QQQ, 1/4 IWM
Study VI. 2003-10 (SPY/QQQ/IWM)
· MIPS3/MF Model; Buy/Short
Buy/Hld Buy/Sht Buy/Sht Buy/Sht
SPY SPY QQQ IWM
43% 481% 574% 808%
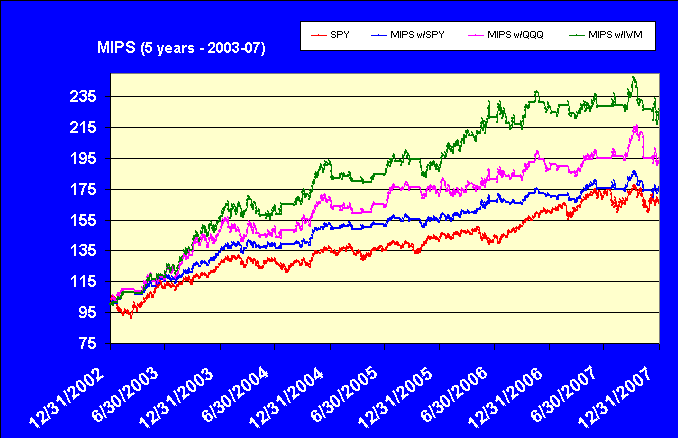
SECOND (the period of 2003-07)
To be more illustrative, we have included below an "expanded" view of the performance of MIPS3/MF trading
SPY, QQQ, IWM during the "slow-growing" up market in 2003-07
- from this graph, you can see the importance of trading ETFs other than SPY in slow up markets
SPY MIPS3 MIPS3 MIPS3
Buy/Hld w/SPY w/QQQ w/IWM
65% 75% 95% 125%
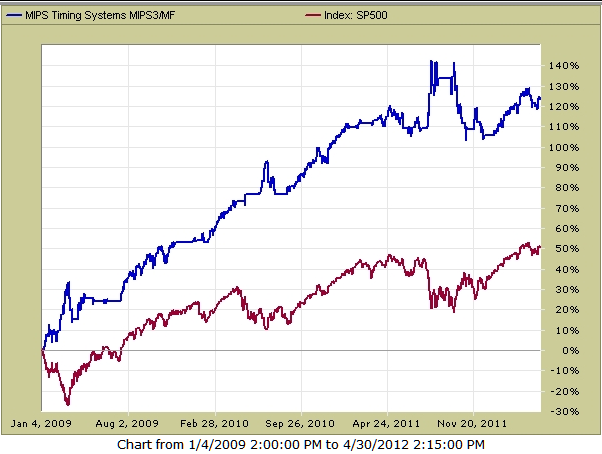
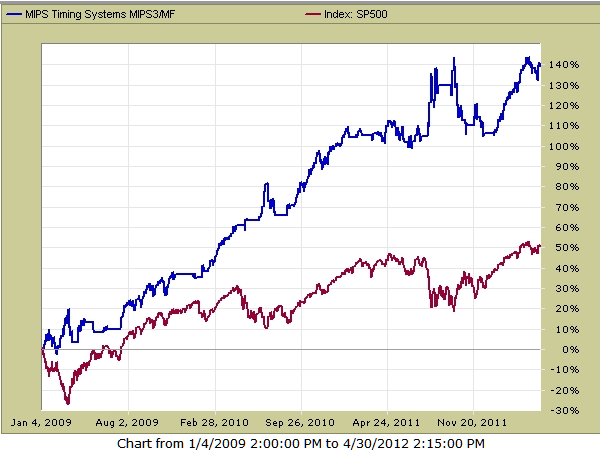
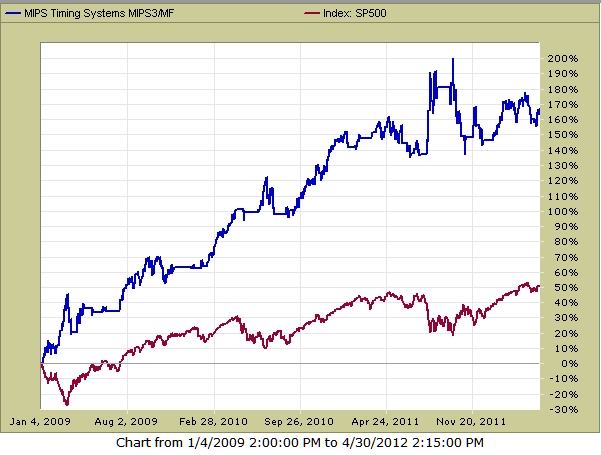
THIRD (the period of 2009-12 YTD)
The performance of MIPS3/MF trading SPY, QQQ, IWM in the very fast-growing up market in the time frame from
2009-2012 YTD is shown below (graphs from TimerTrac.com).
SPY MIPS3 MIPS3 MIPS3
Buy/Hld w/SPY w/QQQ w/IWM
50% 125% 140% 165%
Graphs for each of the above follow:
SPY (+50%) - MIPS3/MF Trading SPY (+140%)
SPY (+50%) - MIPS3/MF Trading QQQ (+140%)
SPY (+50%) - MIPS3/MF Trading IWM (+165%)
Hope this helps ...
Paul Distefano
Founder/CEO
MIPS Timing Systems, LLC
Houston, TX
281-251-MIPS(6477)
Saturday, March 24 2012
MIPS Members:
The stock market is now in relatively new, uncharted waters (as least for newcomers). Said another way, the SPY has not been in the “territory” above $145/share since 2008.
So, where do we go from here and how do we get there ?
Intermediate-Term Cycles
We all know that MIPS3/MF identifies intermediate-term cycles (weekly/monthly cycles) in the market, and not short-term cycles (daily cycles) nor long-term cycles (annual cycles). For example, in graph #1 below, the black line would be indicative of a very long-term cycle (5-year trend), and the red lines would be indicative of intermediate-term cycles (monthly/quarterly trends). Of course, any timing model that could accurately identify intermediate cycles, and trade the resulting trends long and short, would produce much better results than just “riding the long-term wave”. This is what MIPS2/LF and MIPS3/MF do, and they do it well. And, these are he models that we follow. [BTW – MIPS1/VLF tracks long-term (annual) cycles and trades an average of only 1 time per year.]
BUT, IS THERE ANYTHING THAT WE CAN LEARN FROM LONG-TERM CYCLES. The answer is yes, so lets go to graphs #2/3 below to see what we can learn.
Graph #1
Graphs #2/3 – Long-Term Cycles
Everyone knows (or should know) that over the last 50 years, the market has a long history of repeating the same pattern (or cycle) over-and over. This cycle goes up for roughly 4-6 years and then drops 30-50% over the next 1-2 years. For simplicity, let’s just say that a very frequent stock market cycle is up for 5 years and then down for 2 years.
You can see these repetitive cycles in graph #2 below for the 18-year period between 1965-1983 and in graph #3 below for the period 1995-2012. These are the type of market movements where the fat cats and the hedge funds make most their money (NOT in up markets only), and where the little guys get clobbered.
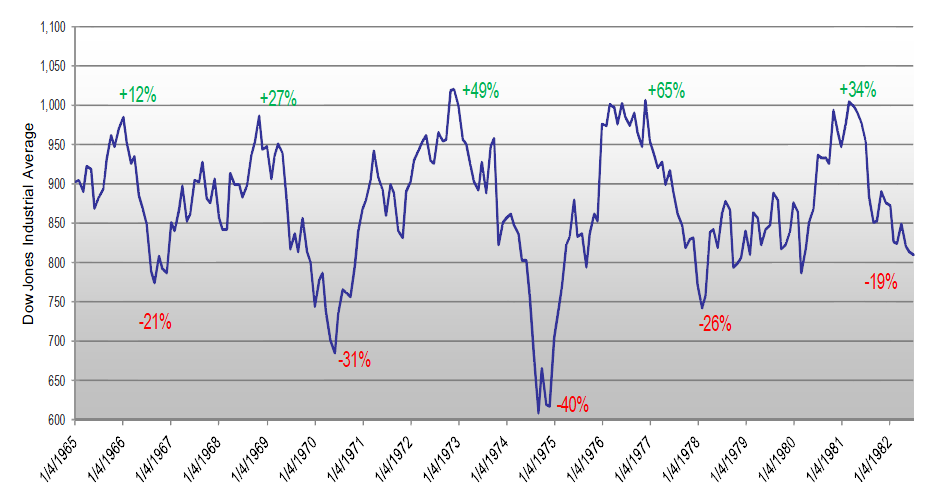
Graph #2
This graph shows the Dow from 1965-1983. In this 18-year period, buy-and-hope investors would have been down about 15% (really much more, because they could have basically doubled their money by being invested in 4% CDs or US Gov’t bonds in those 18 years) !!! Without some type of market timing, how could anyone have made money in this 18-year market ???
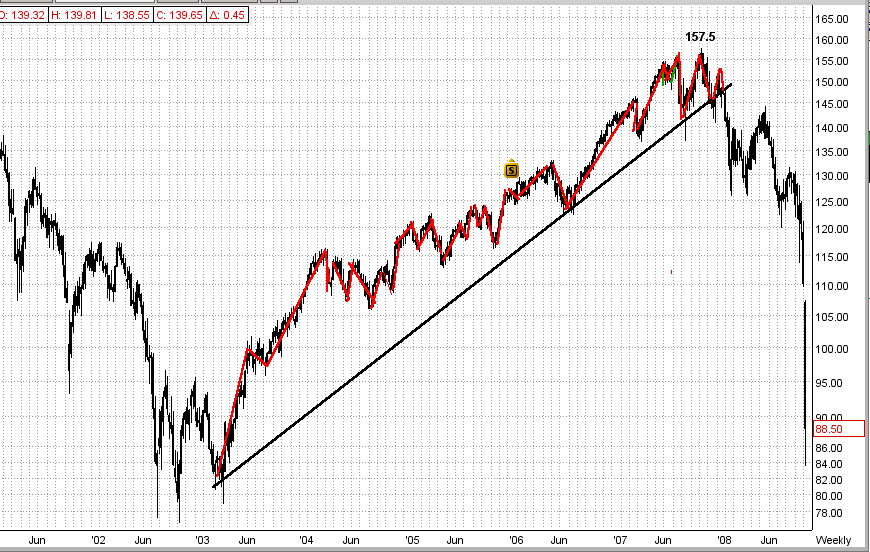
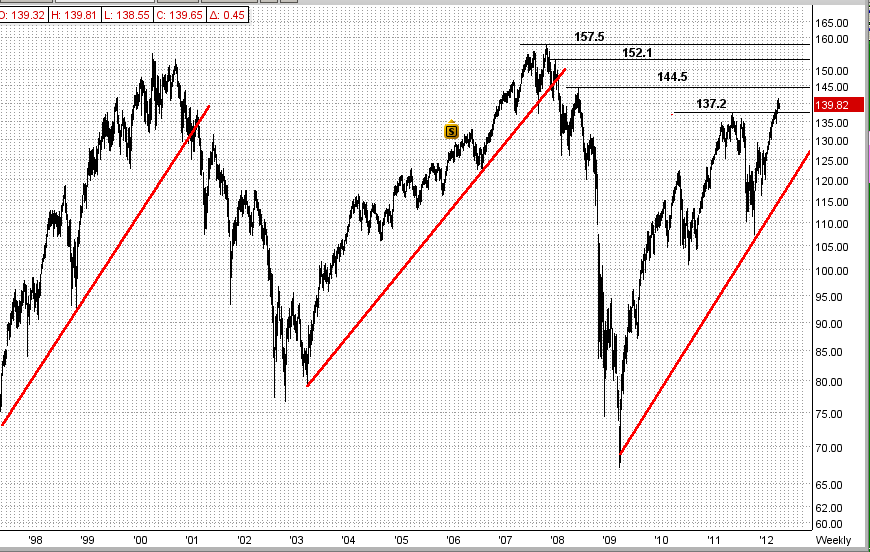
Graph #3
The graph below is for the period 1995-2012. In this graph, the red lines show the long-term trend lines. Even though MIPS3/MF trades the intermediate term cycles within the long-term cycles, by observing the long-term cycles we can see that:
(a) long-term trends are not random,
(b) long-term trends seem to be very similar in nature,
(c) there are very good “shorting” opportunities, even in up-trending markets, and
(d) once started, they go on for years (again, like up for 5 years and down for 2 years).
The first long-term cycle in graph #3 ran for 5 years (from 1995-1999) and the second one also ran for 5 years (2003-2007); but the third (current) long-term cycle has been going up for only 3 years (2009-2011). Does this mean that our current 3-year “bull” has two more years to run? Maybe, or even likely.
And, the entire world is anxious to see if the Dow will break its all-time high of 14,164 or if the SPY will break its all-time high of $157.5/share made in 2007 (which is only 11.5% higher than Friday’s close). To do so, the SPY would have to break major resistance levels at 144.5 and 152.1 to get there (see these resistance levels in graph 3). My guess is that the big guys would like to see the SPY break its all-time high (and they can make it happen) and the little guys are just now likely to start moving money from fixed income assets into equities. Both (or maybe just either) of these would push the market higher. This is NOT a prediction, just an observation.
And remember, if the above does not happen, the market will most likely drop and drop fast. Either way, MIPS will detect the trend. So, let’s be patient and wait for MIPS to tell us what to do.
Graph #3
Thursday, March 15 2012
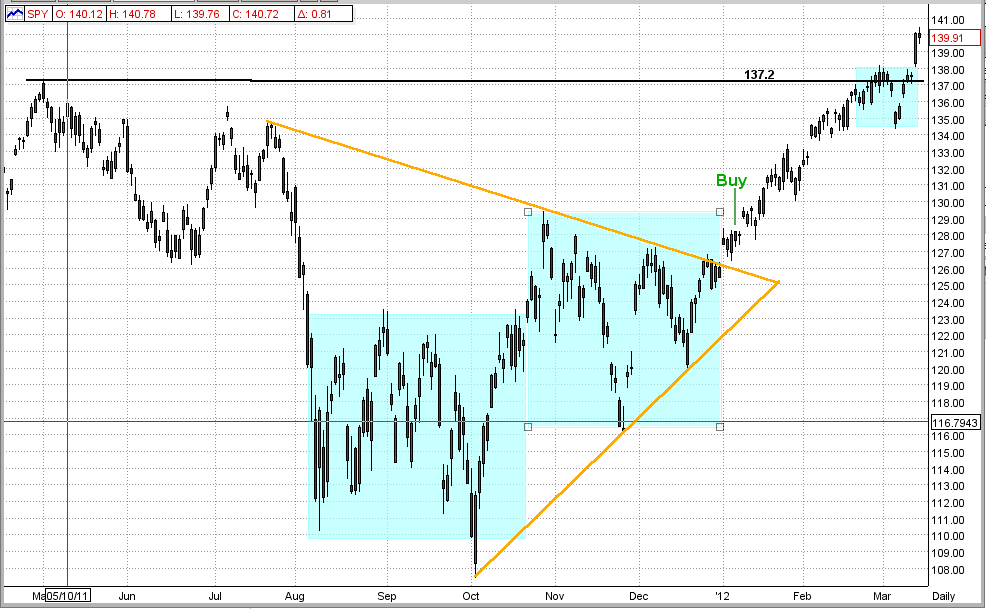
1st Graph (daily data)
FINALLY, the SPY definitively broke its upside resistance at $137.2, but only after about 8-10 failed tries. (See the 1st graph below). The Buyers finally "yanked" the SPY away from the Sellers in this tug-of-war and we are now at $139.91, and that is a good position to be in. So, what happens from here (see 2nd Graph)
Graph #1 - SPY Breaks $137.2 Resistance
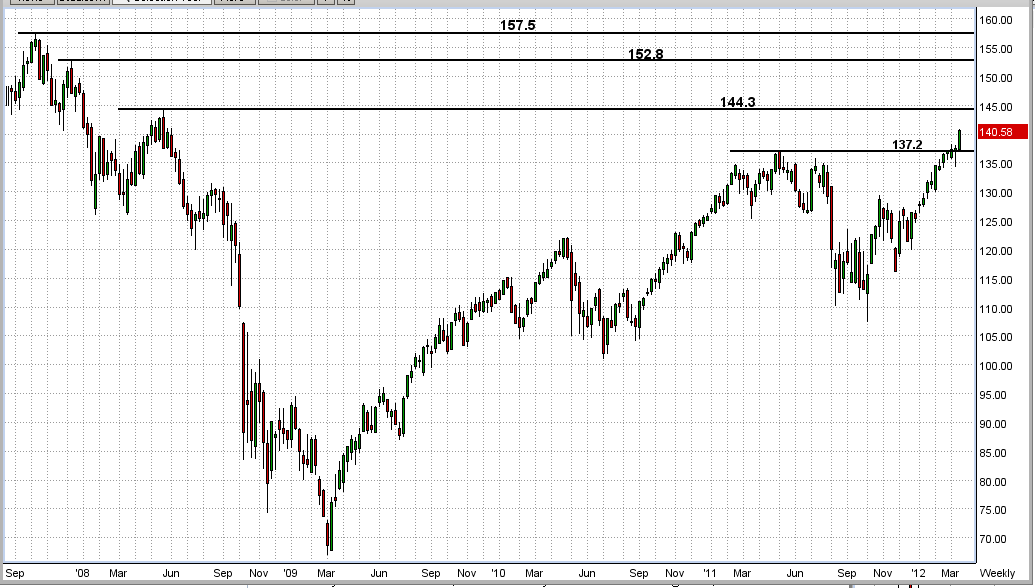
2nd Graph (weekly data)
This is simply a graphic view of the next three upcoming "resistance levels" that we will have to contend with, at 144.3 and 152.8 and "The Big One" at 157.5. The latter is "The Big One" because it was the HIGH for 2007. Does the market have enough "steam" to reach or surpass this "pinnacle" point at $157.5?
Wouldn't that be nice? None of us knows the answer to that, but we do have MIPS to guide us along the way. Stay tuned...
2nd Graph - Future Resistance Levels
|


