Monday, August 17 2020
See the graph below. On the top right, you will see that the SPY has been within "breaking distance" (less than 1.5%) of its all-time high (ATH) for the last 5 trading days. Normally, the longer it takes the SPY to break above its ATH, the stronger the break to the upside will be.
As always though, if the SPY fails to break above its all-time after like over 10-12 days, it could head south at a rapid pace into "correction" territory. There are times, however, when the SPY breaks above and below its ATH a few times before it makes up its mind on which way to go for the long term.
This is a very complicated period in the market, so we should wait until MIPS tells us what to do next.!!!
- MIPS is still long and strong at this time...
Paul Distefano, PhD
Founder / Lead Developer
MIPS Timing Systems, LLC
281-251-MIPS(6477)
408-234-8348 (Cell)
Thursday, August 06 2020
In a previous Blog (see "Previous Blog" below), we showed "The Gap" that the market (S&P 500) would have to go through to reach new highs. In the graph immediately below, we can see that the SPY did just that in short order this week as it broke out of "The Gap" to the upside today. Now, the SP 500 is only about 1.5% from its all time high. Read on...
I think the big question now is "where will the market go from here in the short-term if it moves into new all time high territory?" Usually when markets approach new highs from a big distance below, they "stall" and test above and below the old new high for several weeks. Even considering the above, at this time, there is nothing to stand in the way of the market plowing through at the rate that it has been going.
As we all must know by now, almost all of the recent upside movement in the market has come from less than 10% of the total stocks in the SPY and QQQ. And, a large portion of these has come from the FAANG stocks, Microsoft, and a few more (FB, AAPL, AMZN, NVDA, NFLX, GOOG, MSFT, and a handful more). Of course, these stocks are now way overbought, and any disturbance here now could start a major sell-off and correction.
And remember, quantitative models classify markets as Up or Down by its movements, momentum, trends, etc and they DO
NOT need to know (or analyze) why. Quantitative models predict market directions from market movements, applied mathematics, predictive analytics, artificial intelligence, etc (and not solely from earnings, debt, PE ratios, etc).
MIPS is most valuable in markets like this by keeping us Long while the market is still going up, and getting us into Cash (or Short) if and when the market is falling.
Good trading...
Paul Distefano, PhD
Founder / Lead Developer
MIPS Timing Systems, LLC
Houston
408-234-8348
Saturday, July 25 2020
As most of you know there are probably over 50 popular "Patterns" that investors use to forecast which direction the
market may be going. These patterns go back to over 50-70 years ago, when quantitative investors searched many past
years to identify certain patterns that seemed to (a) repeat themselves, and (b) have a high probability of an accurate
forecast going forward. Most of these were published in the news or on the Internet, and many investors follow them
with high confidence. A few of the most popular patterns are "double tops/double bottoms", "golden cross/death cross",
"MACD", "Moving Average Crossovers" , "Flags" , etc.
A lot of these were published many years ago and were confirmed by data back 20-50 years from that time. The problem
with this is that the market behavior in the past (50-70 years ago) has changed dramatically, so some of these are
completely obsolete. If so, then why do people still use them. My belief is that, if enough of "today's investors" believe that
these patterns will accurately predict what they claim, the buy/sell action from these "today's investors" will force the pattern
to behave as promoted. In other words, they perform as a "self-fulfilling prophecy".
Even if a self-fulfilling prophecy is the reason, we still need to pay attention to the results to help us understand what results
the current massive buying/selling in the market will cause.
So, where are we now (see the graph below, using Vanguard's VOO for the S&P 500/SPY):
- See the big "GAP" in the SPY between 2/21/29 (Friday close) and 2/24/2020 (Monday close)
- investors don't like an "empty" GAP, so it can act like very strong upside resistance now
- As you can see below, the SPY recently broke upward into the GAP territory, but failed to top it and dropped back down
- Most likely the market will try at least one more time to break above the GAP and head to a new All Time High (ATH)
- But, the ATH will probably behave as a strong resistance to the market climbing above it.
There is a strong possibility that, if the market does not break into "new high" territory in the next few weeks/months, and if the
economy does not show some attractive growth by then, this will basically lead to a real bear market (a drop of 25-50%) !!!
MIPS is still long, so let's wait for MIPS to tell what to do next...
- don't be afraid of a bear market, because MIPS performs well in down-moving markets...
Good Trading...
Paul Distefano, PhD
Founder / Lead Developer
MIPS Timing Systems, LLC
Houston, TX
281-251-MIPS(6477)
408-234-8345 (cell)
Sunday, July 12 2020
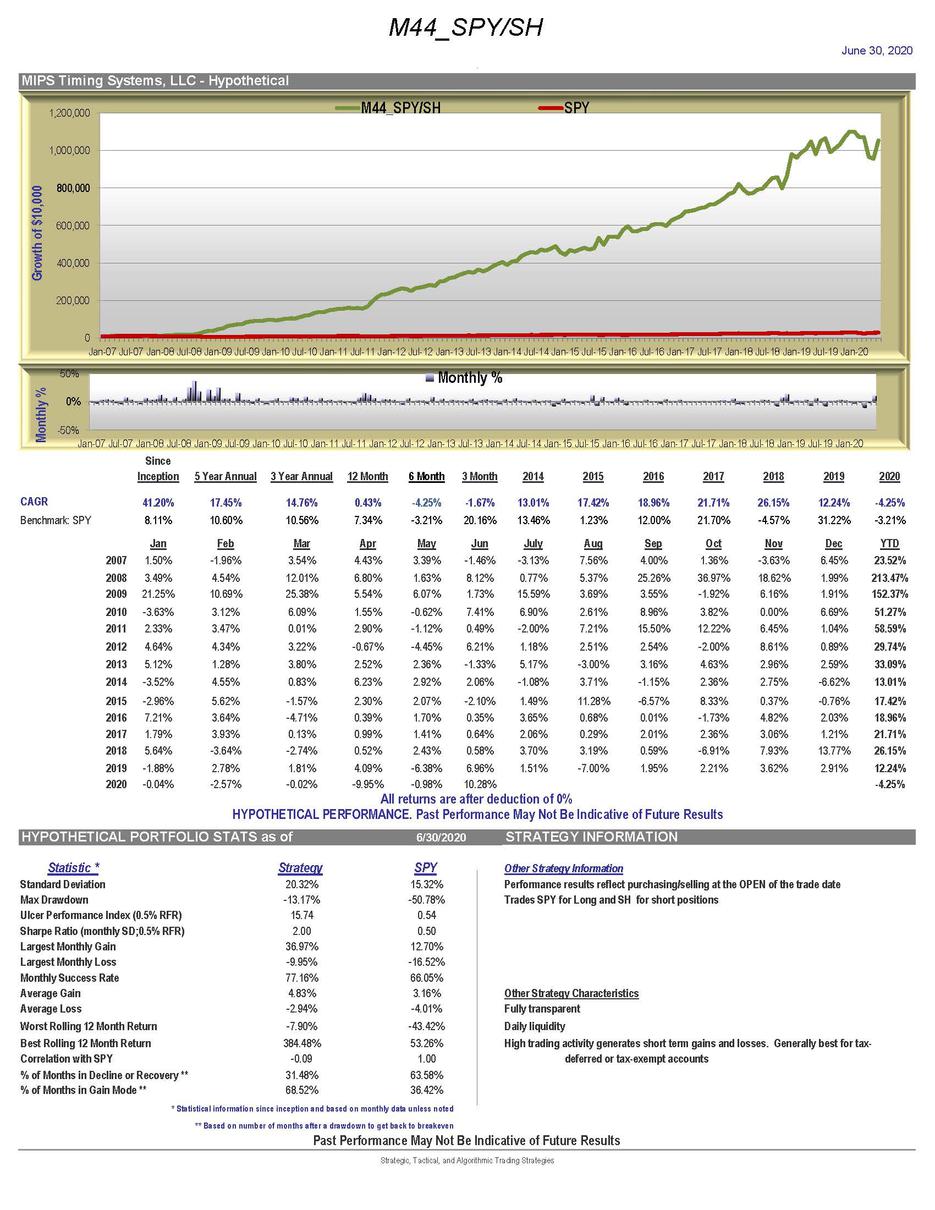
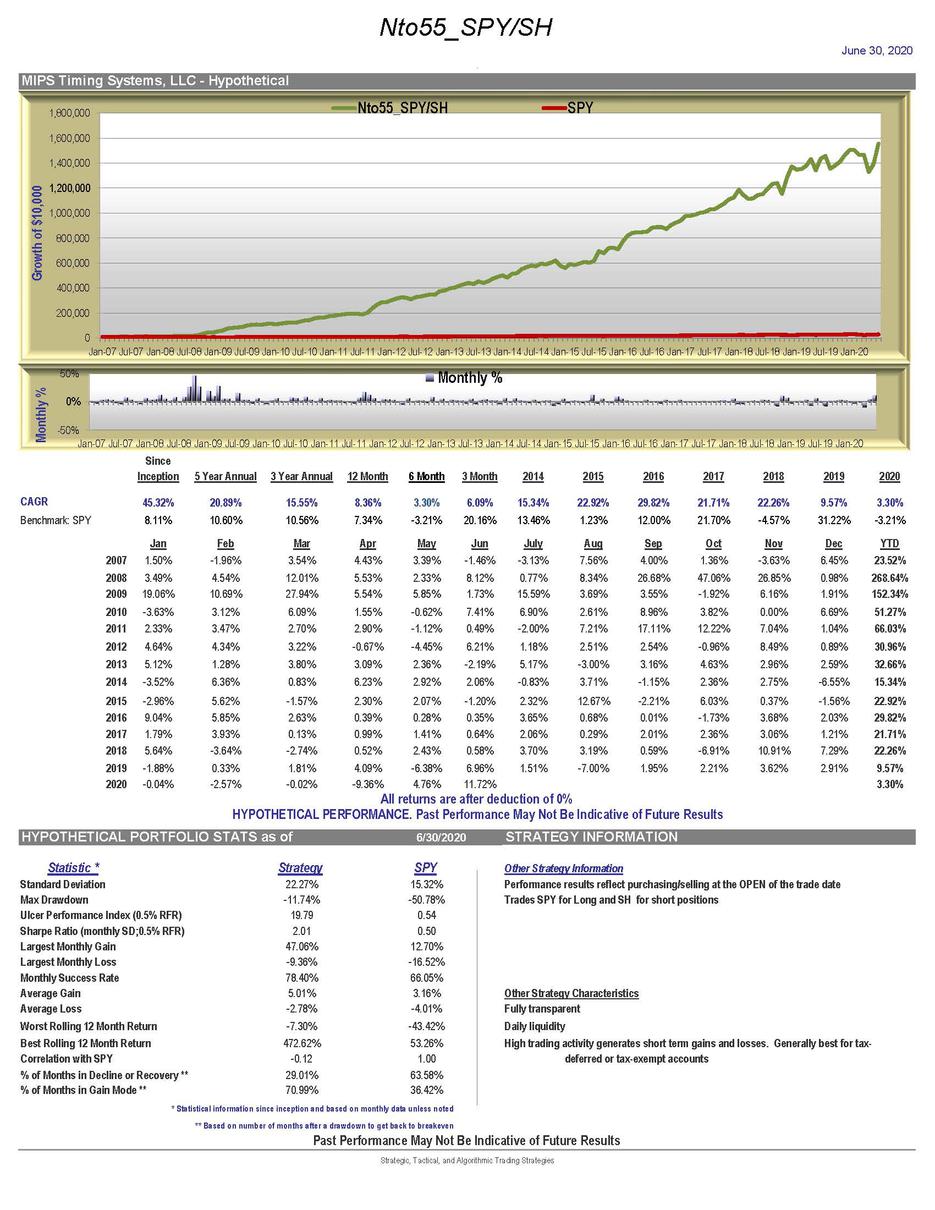
GREAT NEWS - THE NEW VERSION OF OUR MIPS MODELS HAS "GONE LIVE"
THE RESULTS ARE TERRIFIC (you will most likely not find a better model)
WE ARE BOTH HAPPY AND PROUD
See complete list of new Fact Sheets at => https://mipstiming.com/fact_sheets
All Fact Sheets start with a $10,000 Investment
Tuesday, June 23 2020
The stock market of 2020 has wreaked havoc on millions of investors. And, it has put a big dent in many retirement accounts. Most investors feel and believe that the worst is over, but is it?.
First, please understand that many market "crashes" are quickly followed by bear market rallies (aka "Sucker Rallies"). They are called Sucker Rallies because about 60-65% of the time "the rally" runs out of steam and the market turns down into a 2nd leg of the original "crash" that is even more devastating than the 1st leg down. However, professional investors have determined that in the past, if the rally recovers over 50% of the 1st leg down, in most cases the "crash" has bottomed. That appears to be what has happened now, but maybe not.
In the graph below, you can see that the market (the SP 500) bottomed out after a 34% drop (1st leg down), recovered 50% of this drop about 3 weeks later, spent 24 days trying to break above the 200-Day EMA, and since then has spent the last 5 weeks working its way to "New High" territory. If the SPY makes it to the New High territory, it will be quite a battle there between the Bulls and Bears.
The real question on my mind is "Is the market going to make it to the New High territory or tumble back down somewhere along the way"?.
Read on...
This time is different (yeah, right) because we are in the middle of a virus pandemic and the government has approved trillions of dollars in distributions to individuals and US businesses. And, even much more, the Fed has promised "no limits" in loans, buying bonds, and indirectly buying stocks. To date, the Fed has pumped trillions into the economy. This, of course, has been the main catalyst in the up moving markets (very abnormal). This cannot continue, so what's next?.
At this time, we are aware of and reading about multiple brick walls along the way up that could completely reverse this market growth into a very fast acting "free-fall' down". This includes the directions of the virus, ups-and-downs in employment, corporate financial numbers, and what the Fed does next.
Another very surprising example of what the market will soon face is nicely outlined in the following article from CNBC entitled:
"There’s a wave of selling estimated to be in the billions that’s about to hit the stock market" Click on =>
https://www.cnbc.com/2020/06/23/theres-a-wave-of-selling-estimated-to-be-in-the-billions-thats-about-to-hit-the-stock-market.html?__source=iosappshare%7Ccom.apple.UIKit.activity.Mail
Please read at least part of the above and be conservative with your money (like only investing 50-65% until this blows over).
Good News !!!
On 5/18/2020, we released our new version of all the MIPS models to accommodate:
- "fast acting markets", and
- "high volatility markets"
Our tests show that the new versions perform twice as good as the recent versions that we replaced (more later) !!!
PS - MIPS users do not have to do anything different (just follow signals from the model that you have been following).
Paul Distefano, PhD
Founder / Lead Developer
MIPS Timing Systems, LLC
Houston, TX
281-251-MIPS(6477)
408-234-8348 (my cell)
Monday, May 25 2020
This week could determine the direction for the stock market (SP500) for the next Bull or Bear "run".
Graph #1
As you can see in Graph 1 immediately below, the SPY fell like a rock in Feb/Mar 2020 (Leg#1 down), but recovered to what the "pros" say is the normal
"Retracement Point" ( https://www.investopedia.com/terms/r/retracement.asp ). These "Mr. Know It All's" claim that all bear markets tend to bounce up from their first bottom until the market has recovered about 50% of its first drop. From there, the market will decide if it will continue up or to fall back down for its 2nd drop ("Leg#2 down). BTW, most of the time in bear markets the market does just that, but these are not normal times.
So far, the market has followed the above to the tee, but it has hit two stages of uncertainty from late April until now (go to Graph #2 below)
Graph #1
Graph #2
Graph #2 below is simply an expansion of the second half of Graph #1 (to make my comments below easier to see in the graph).
The purple "flat market" or "sideways pattern" in Graph #2 shows the uncertainty around the retracement point very well. As can be seen in this purple pattern, the market bounced around in a plus/minus 2.25% range for 21 days (if that isn't uncertainly, what is it?). And, you can see that the SPY hit (but failed to break above) the SPY 200-Day EMA line 4 times (blue line).
But then, on May 18th the SPY broke out of the purple pattern AND sprung above the 200-Day EMA as shown in the smaller, brownish pattern. The market has traded in this very small range for 5 days; 4 of which closed above the 200 EMA.
So, that leaves us here on May 25th wondering what will happen next. My guess (not MIPS') is that, over the next several days, the market will break above the 200 EMA decisively and go up from here for a while. Even with that opinion, I still believe that the market will re-test its March lows before it goes back into a real bull market. . My opinions are OK, but I follow MIPS... So should you.!!!
Graph #2
Good Trading ...
Paul Distefano, PhD
CEO / Lead Developer
MIPS Timing Systems, LLC
Houston, TX
281-251-MIPS(6477)
408-234-8348 (Cell)
Sunday, May 24 2020
- In this Blog, my reference to ‘the market’ is the SP500 ETF (SPY)
This market we are in now (and have been in for the last 3 months) is one of most difficult, most dangerous markets we have seen in many decades (like all the way back to 1933).
In the last 80+ years, the SPY has ‘averaged’ gains/losses of roughly 12% per year. That results in average ‘changes’ of about 1% per month (or 0.05% per day). This 2020 market dropped 34% in 1 month and 14% in two days. And, the market changed over 8% in a single day several times in the first quarter.
See stats below for the SPY in the year 2020:
1) One Month (Feb 21- Mar 23) -34%
2) Five Days (Feb 21 – Feb 27) -15%
3) Two Days (Mar 11- Mar 12) -14%
4) One Day (Mar 16) -11%
You have to be aware that those kinds of movements are much, much faster (and larger) than any in the past; and that makes them very dangerous and very difficult to 'track'. Few (if any) trading techniques (or retail timing models), are now designed to work well in this type of market behavior. For example, some of the top performing timing models in 2020 YTD ranked by 3rd party tracking companies have terrible long-term performance records. Outside of stock markets, if a fighter jet is programmed to travel at 3,000 mph (like the USA’s F15), it would fail in combat with an enemy jet travelling at 8,000 mph (if possible). So, in all cases like this, the software would need to be updated to handle any and all new faster acting conditions.
We at MIPS are not just sitting around in this crazy market that moved faster in a small part of one month (Feb'20) than any other market has in the last several decades. MIPS is currently designed to work well in fast markets, normal markets, slow markets, and flat markets. The recent market behavior has shown us that we need to add very fast moving market conditions to our models; together with protection from large daily losses from markets with unusual high volatility .
Our development team has been working 16-18 hours daily for the last 10 weeks adding these new features to our models. I am thrilled to say that we have added several algorithms to help MIPS perform much better in very fast moving markets with unusual high volatility. The performance results from our new models are significantly better; and with a little more testing we will release the new versions of all MIPS models very soon. The graph below shows that the new version of the MIPS/Nitro model would have produced results roughly two times better than the current version.
Confidential - Below is how the new MIPS/Nitro model's performance looks now (in final testing)
Black - New Fast Moving/Highly Volatile (FM/HV) MIPS/Nitro Version of the Model
Orange - Current MIPS/Nitro Model
Paul Distefano, PhD
CEO / Lead Developer
MIPS Timing Systems, LLC
Houston, TX
281-251-MIPS(6477)
408-234-8348 (Cell)
Sunday, April 26 2020
Is the market that we are in now going to be a duplicate of 2008 and 2000 ???
- what's going to happen at the 50% Retracement Level this time ????
2008 Market Crash

2000 Market Crash

2020 Market Crash
Paul Distefano, PhD
CEO/Founder
Tuesday, April 21 2020
UPDATE
- see the last day in the chart immediately below...
- is this a "Breakout" to the downside?
- I think so, but am not quite ready to bet on it (more analysis tonight may change my mind)
- more later...
PD

Paul Distefano, PhD
Founder / Developer
MIPS Timing Systems, LLC
Houston, TX
Monday, April 20 2020
In over 80% of the MARKET CRASHES since the Great Depression, the market has started by dropping between 20-35% somewhat quickly, and then it bounced back up and recovered a certain % of the 1st leg of the drop (this is referred to as a "Sucker Rally"). History has shown that, if the rally bounces back up and "retracks" (my word) more than 50% of the initial drop, the "Crash" is over. I call this the "50% Retracement Line"
On the other hand, if the Sucker Rally fails to bounce above the 50% Retrackment Line, the market will head back down to either (a) test the previous low, or (b) drop further to between minus 45-60% from the all-time high. We are experiencing just this at this time.
As you can see in the graph below, so far this market has followed this pattern from the initial drop of about 34%; into a Sucker Rally. The Sucker Rally is now right on (or slightly below)
what we call the "50% Retracement Line". As you can see, this market drop has moved VERY FAST since it started on 02/20/2020. But, since it got real close to the 50% Retrackment Line, it has "stalled" for seven straight days (i.e., it traded in a plus/minus 2% range). Compare this to the first seven days after 2/20/2020, where the market dropped about 15% !!!
So, where do we go from here... Let's stay alert and follow MIPS signals.
CAUTION: in this crazy market, lots of things that followed some distinct patterns in the past might not even come close to doing that in this fast moving, volatile market.
SPY YTD in 2020 through April 20th.
Paul Distefano, PhD
Founder / Developer
MIPS Timing Systems, LLC
Houston, TX
|


