site map
my account
contact
our facebook page
Latest Posts
Archive

+
...

Market Timing

Sunday, December 29 2013

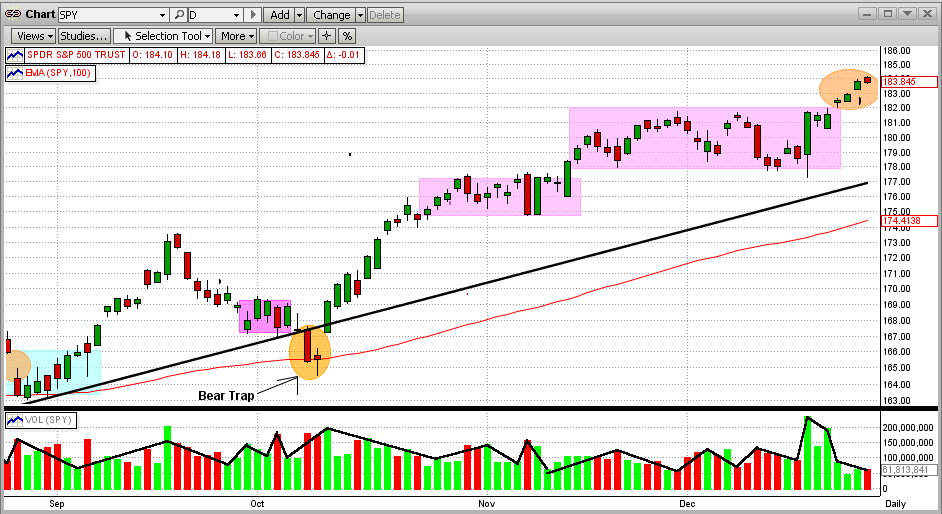
In our previous blog below from 12/22/13, we showed how the SPY had climbed quickly back to the top of its flat/sideways trading pattern on high volume. From this one could conclude that we should have expected a "breakout" to the upside this past week.  As can be seen in the graph immediately below, we did get an upside breakout this past week, but not what we would call a really strong breakout. This is mainly because of its low volume.  The odds are for this breakout to pick up steam and head higher, but it could very easily turn out to be a "bull trap" that turns lower in the short term.  It is exactly these kinds of situations when we need for MIPS to tell us what to do.

Blog from 12/22/2013

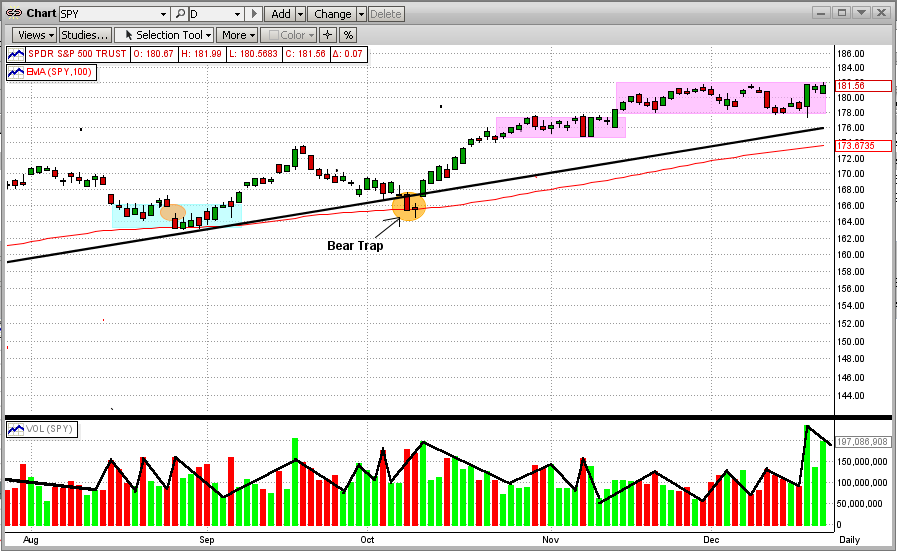
In our previous blog below (from 12/16/13), we told our MIPS members to basically ignore the 5-consecutive-day drop in the SPY that occurred in the previous week (see the last graph below). The reasons for this were: (a) the entire drop was just a little over 2% and (b) the market was just completing a drop from the top to the bottom of a relatively flat/sideways 15-day trading pattern.

Then this last week, the SPY basically reversed it movement and simply went back to the top of the trading pattern (see graph immediately below). No breakout. So, is this week's move up any different than last week's move down? In many cases, the answer would be no. But, there are some compelling reasons for believing that the recent move up was indeed more telling than the previous move down, even though there was no breakout. One reason is that the trading pattern is now over 20 days old, and sideways trading patterns usually do not last much longer than that. But the BIG reason to think that this move up is different from the prior moves is that the move up was on volume almost two time higher than the volume for the prior 30 days. Thus, one can conclude that the move up was the result of the big guys buying. That's huge!!!

The real story will most likely unfold within the next week or two, so let's stay long and wait for MIPS to tell us what to do next.


Posted by: Dr. G. Paul Distefano AT 10:55 pm   |  Permalink   |  Email
Sunday, December 22 2013

In our previous blog (from 12/16/13), we told our MIPS members to basically ignore the 5-consecutive-day drop in the SPY that occurred in the previous week (see the last graph below). The reasons for this were: (a) the entire drop was just a little over 2% and (b) the market was just completing a drop from the top to the bottom of a relatively flat/sideways 15-day trading pattern.

Then this last week, the SPY basically reversed its movement and simply went back to the top of the trading pattern (see graph immediately below).  No breakout.  So, is this week's move up any different than last week's move down?  In many cases, the answer would be no.  But, there are some compelling reasons for believing that the recent move up was indeed more telling than the previous move down, even though there was no breakout.  One reason is that the trading pattern is now over 20 days old, and sideways trading patterns usually do not last much longer than that. But the BIG reason to think that this move up is different from the prior moves is that the move up was on volume almost two time higher than the volume for the prior 30 days.  Thus, one can conclude that the move up was the result of the big guys buyingThat's huge!!!

The real story will most likely unfold within the next week or two, so let's stay long and wait for MIPS to tell us what to do next.


Posted by: Dr. G. Paul Distefano AT 09:16 pm   |  Permalink   |  Email
Monday, December 16 2013

We at MIPS have always talked about and pointed out how the stock market moves in cycles.  The MIPS models are designed to track intermediate-term cycles (like monthly cycles).  But, of course, sometimes the market moves in "wiggles", not true cycles (e.g., really small day-by-day wiggles).  Trying to trade wiggles leads one to much higher trading frequencies, and many times to getting whipsawed.

The last few weeks (and, in fact, several other times this year) are good examples of why one should not chase wiggles. See the graph immediately below.  Looking at the market swings daily makes the changes look violent.  We received many calls and emails from MIPS members last week asking what was going on in the market.  Our response was "nothing that we should worry about, yet".


When we examine the market in the time frame that MIPS was designed to perform in the graph below, we now see a simple flat/sideways trading pattern, with the SPY trading plus and minus 1.13% around its mean-line value of $179.90/share. Now, that does not look so violent, and it is not violent in the context in which we are trading. These types of changes may be important to day traders that trade 5-10 times/day, but not to us. The moral of the story is for us to evaluate market moves in the context of our trading profile.


Which way the market moves from here is anybody's guess, and mine is that the market will move out of this sideways trading pattern (up or down) depending upon what the Fed says about its plans to "taper" pumping $85 billion/month in its bond-buying spree to keep interest rates artificially low.  And, my guess is that the Fed will say it will not taper until 2014, and that will lift the markets.  But remember, it is not what I think that matters, but what MIPS tells us.
 

Posted by: Dr. G. Paul Distefano AT 11:58 pm   |  Permalink   |  Email

MIPS Timing Systems
P.O. Box 925214
Houston, TX  77292

An affordable and efficient stock market timing tool. Contact MIPS
281-251-MIPS (6477)
E-mail: support@mipstiming.com