Sunday, May 25 2014
During most of 2013 and 2014, we have received emails from MIPS members wanting to know why the MIPS models stayed Long for so long without often going short. This was due to the fact that our MIPS3/MF model, for example, traded only 2 times in 2013 and 2 times in 2014, the lowest in the MIPS3/MF eight-year-plus history.
When asked why they thought that MIPS should have traded more often, they mainly said the "volatility in the market" (as in the SPY). On the surface, I can certainly see why they would feel that way. See the graph below. From this, it looks like there were several good opportunities to short, but the risk of getting whipsawed in a market like this is very high. In fact, many timing models did get sucked in to short positions several times, only to get whipsawed almost every time.
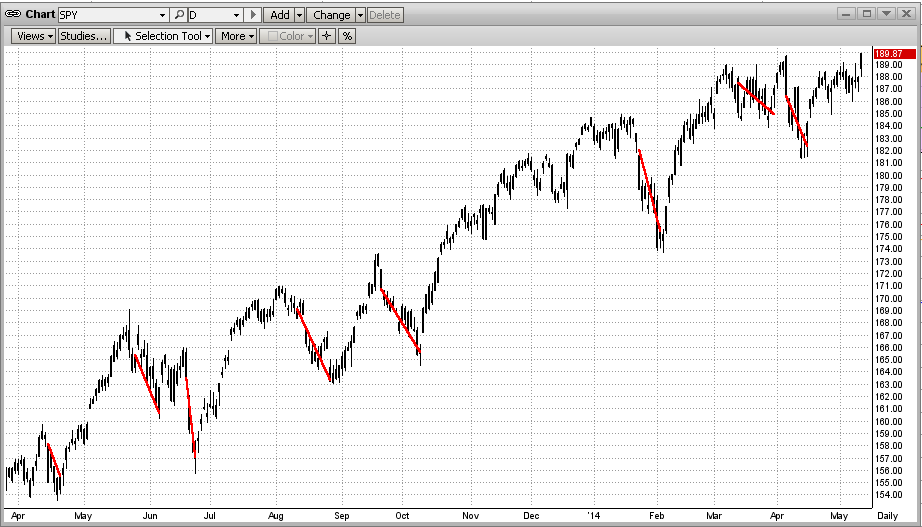
It is very difficult to ascertain from the "surface" of a price action graph where the market will go next or what the underlying strength of the market is at any point in time. This is one reason why MIPS provides its proprietary Market Strength Indicator (MSI) graph on its website for MIPS members at:
=> http://www.mipstiming.com/msi___mips_members .
Even though the human eye and mind may have trouble "reading the tea leaves" from the price action of the market on a bar chart or other graph, the underlying mathematics and intricate indicators in a " very good" timing model see things differently, and have a much better chance at interpreting the most likely direction of the market in the short term. Of course, you never want to bet against the trend. By a "very good" timing model above, we mean a timing model that has sufficient built-in "coverage" of the movements in the market to arrive at sound decisions going forward. This means timing models with enough math and enough technical indicators to work well at least in slow up-markets, fast up-markets, slow down-markets, fast down-markets, and flat/sideways markets. This CANNOT be done with any degree of consistency or accuracy with a timing model (if you could even call it that) that is made up of simply 6-12 "off the shelf" market indicators. On the other hand, a timing model with, say, 100 or more published and/or proprietary market indictors does have a good chance to be consistent in calling the market trends correctly. Even then, the degree of accuracy of a model like this depends on how well the various indicators are "matched" with each other, how the model's voting algorithms are designed, the degree of self-learning/self-correcting capability of the model, its ability to identify certain market patterns that cause timing models to waver, etc.
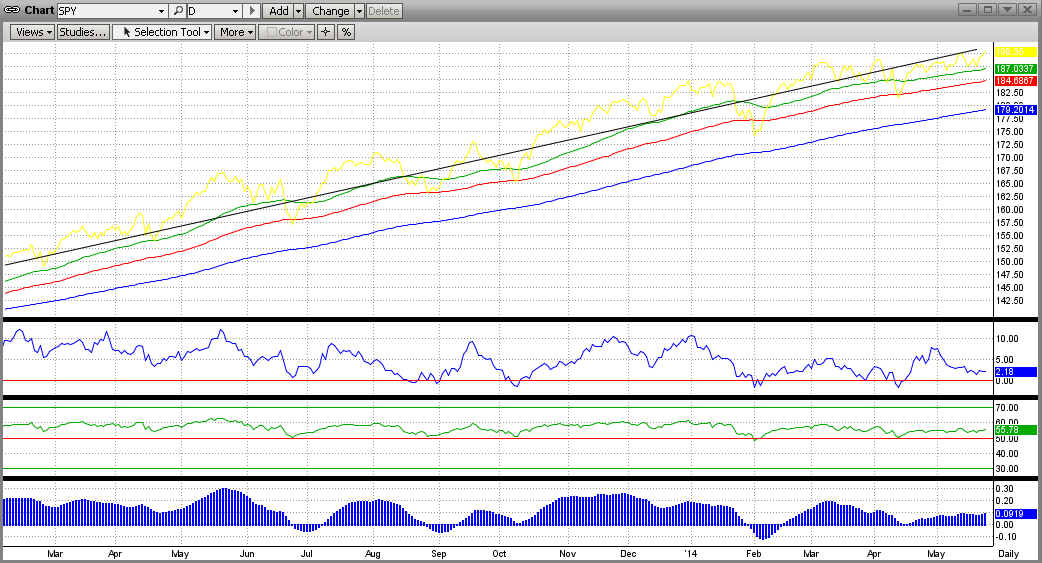
To show a simple example of what the guts of a market timing model looks like, the graph below is an X-ray view of part of the MIPS3 model. This is how some of the internals of the MIPS3 model see the raw price data from the first graph above. [This is a visual illustration of just a very small fraction of the internals of the MIPS3 model.]
In the graph below, the top straight line is a long-term trend line and the colored lines come from things like moving averages and other trend lines, or combos thereof (the up-trends here are obvious). The three indicators in the bottom half of the graph below come from things like various slopes of the SPY price, proprietary rate-of-change, modified relative-strength-index, and various mixed oscillators. In all cases, the indicators are "Long" when they are above the zero line, and "Short" when they are below zero.
Hence you can see that, even though the first graph above seems to show various opportunities to go "Short", the majority of the internal MIPS3 indicators in the graph below have been highly bullish throughout the entire period. Ditto for the rest of the MIPS3 model. Therefore, the real reason why the MIPS models have stayed Long for the majority of 2013 and 2014 is that the up-trend was very strong the entire time period and so there were no good reasons to trade otherwise (i.e., don't fight the trend) !!!
This is not to say that the market cannot go south quickly. It can, but the guts of the MIPS models can also change quickly. History has shown that the MIPS models react quickly to big market crashes and/or corrections.
The above is similar to the process followed by doctors who examine patients who come in with obvious "markers" on their body (welts, sores, moles, bruises, coated tongue, yellow eyes, unusual skin color, etc). If the patient's condition is not obvious from the outside, doctors resort to modern-day medical equipment that allow them to look deep inside of a patient's head, heart, back, stomach, etc. (like using X-rays, EKGs, CAT scans, MRIs, colonoscopies, etc). MIPS sort of behaves in a similar way.
So, instead of just looking at the surface data and guessing, we have the guts of the MIPS models to break down every movement of the market into segments, and to examine each one separately to come up with a consensus.
Monday, May 12 2014
For some time, we have been talking about this war between the Bulls and Bears, but we never really defined it. We call it a war, because that is what it is like.
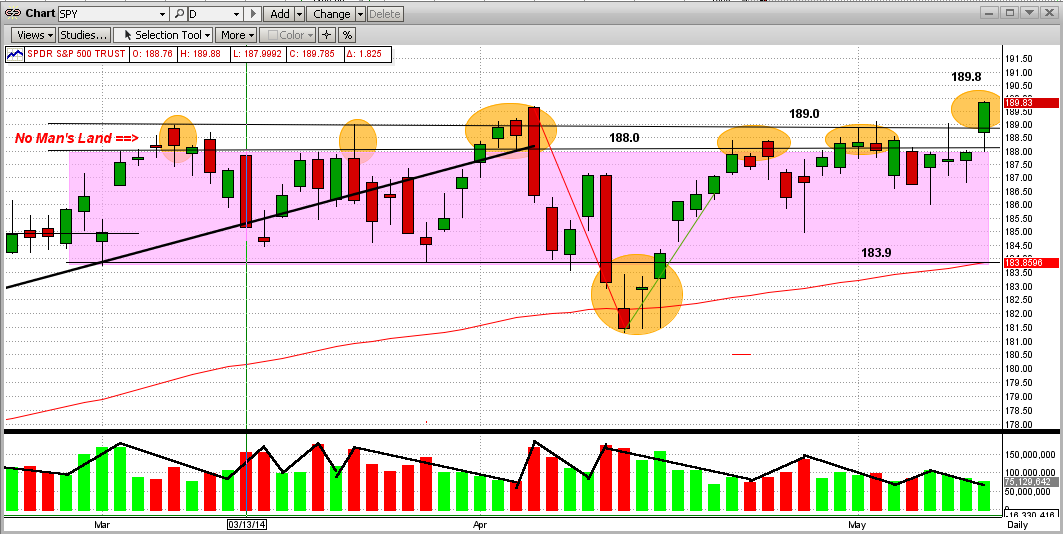
To help explain this, let's refer to the "Battleground" map below, with the following "definitions".
1) The SPY numbers ($188/share) are kind of like "mile markers".
2) The main battlefield is the purple area between markers 184 and 188.
3) The first wall of resistance in the battle is at 188 and the absolute "stone wall resistance" is at 189.
4) Between 188-189 lies an area that we call No Man's Land, that is deadly to try to cross or occupy.
It is like the Normandy Beach in WWII, the Shenandoah River in the Civil War, or a "moat" in the
Middle Ages. The casualties in this "zone" are almost unbearable, but sometimes attackers manage
to cross it. (Like now?)
So, using the above definitions, the History of the Battle of No Man's Land is:
1) Let's say the green bars are attacks by the Bulls and the red bars are retreats.
2) The Bulls attacked the Bear's first resistance level at 188 in the first week of March 2014 and then
pushed through No Man's land to 189 before getting stopped, routed on 3/13/14 and pushed back
to about 183.5 by mid-March.
3) Then there were 5 more broad attacks during the battle (orange ellipses).
4) The Bulls camped at the 188 level or hunkered down in No Man's Land for 26 days/nights in this
2-1/2 month battle.
5) The Bulls hit or broke over the wall at 189 nine times in this battle and failed every time, except on
its ninth try (today), where it stopped at 189.8.
6) One major problem is that the breach today above 189 came on low volume (kind of like the Bear's
super troops were not in this battle).
7) Now it is up to the Bulls to "hold their ground" and/or capture more territory, while the Bears must
concentrate on re-claiming the territory that it lost today.
The Bulls should not celebrate until the market moves higher or at least they retain what they has gained so far.
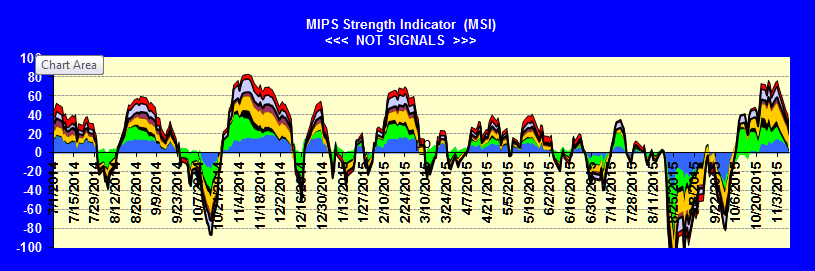
Our MIPS Market Strength Indicator is strong to the upside now, but we all know that this can change quickly.
- see 2nd graph below.
Remember, MIPS may see this somewhat differently, so let's wait for MIPS' signals.
Battleground Map
MIPS Market Strength Indicator (5/12/19140
===============================================================================
<<< Previous Blog >>>
MIPS Members:
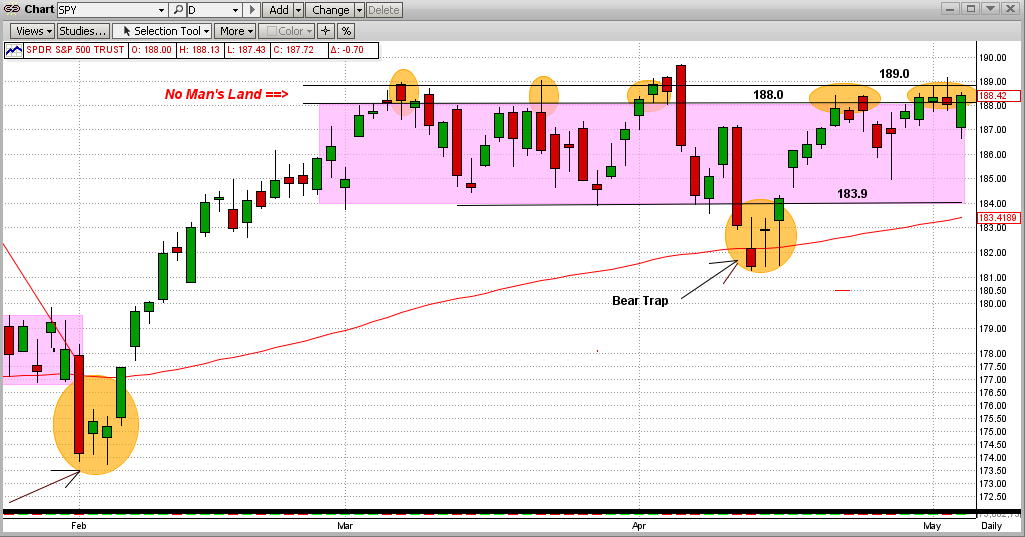
On yesterday's close, the SPY again stuck its head above 188.0 into No Man's Land (e.g., between 188.0 and 189.0). In fact, there is a very interesting phenomenon going on in this very tight range. Let's look at the stats from the graph below.
1) The SPY has been in a rather tight, sideways trading range since 3/03/14 (for over 9 weeks). This is also called a flat or horizontal "pattern", and 9 weeks in this pattern is somewhat rare.
2) The SPY has not been able to break firmly above its strong resistance level at $189.0/share except for a few hours on 4/04/14, then it got "slapped" back down. And, in the entire time period, the SPY hit or stuck its head above the 189.0 level seven times, again only to be slapped back each time.
3) Anomaly - the SPY had been "trapped" in the trading range of 188.0-189.0 (No Man's Land) five times during this period (see orange ellipses in graph below). This is very unusual. In fact, the SPY has hit 188.0 or closed in No Man's Land 23 days (or 47% of the time in the sideways trading range). So far, every time the SPY has stuck its head above the fence at 188.0, it got slapped back to the lower end of the trading range (184-185).

Of course, the SPY will not stay flat forever. It will break out of this flat trading range, and most likely soon. And, when it does, the market's move up or down from the trading range will be bigger the longer the SPY was in the flat pattern.
Which way will it break?
We need to trust MIPS to answer that.
|
Tuesday, May 06 2014
On yesterday's close, the SPY again stuck its head above 188.0 into No Man's Land (e.g., between 188.0 and 189.0). In fact, there is a very interesting phenomenon going on in this very tight range. Let's look at the stats from the graph below.
1) The SPY has been in a rather tight, sideways trading range since 3/03/14 (for over 9 weeks). This is also called a flat or horizontal "pattern", and 9 weeks in this pattern is somewhat rare.
2) The SPY has not been able to break firmly above its strong resistance level at $189.0/share except for a few hours on 4/04/14, then it got "slapped" back down. And, in the entire time period, the SPY hit or stuck its head above the 189.0 level seven times, again only to be slapped back each time.
3) Anomaly - the SPY had been "trapped" in the trading range of 188.0-189.0 (No Man's Land) five times during this period (see orange ellipses in graph below). This is very unusual. In fact, the SPY has hit 188.0 or closed in No Man's Land 23 days (or 47% of the time in the sideways trading range). So far, every time the SPY has stuck its head above the fence at 188.0, it got slapped back to the lower end of the trading range (184-185).
Of course, the SPY will not stay flat forever. It will break out of this flat trading range, and most likely soon. And, when it does, the market's move up or down from the trading range will be bigger the longer the SPY was in the flat pattern.
Which way will it break?
We need to trust MIPS to answer that.
|
|


