HOW WELL WOULD YOU HAVE DONE INVESTING WITH MIPS ?
Let's compare the MIPS Timing Systems' buy/short strategy (MIPS3/MF) to a buy/hold SPY ETF trading strategy for one of the toughest periods in our investing lifetime, that is, the ten-year" period from the beginning of 2007 through to the end of 2017. Of course, it was during this period that the Great Recession of 2008 occurred. This was a very tough period for buy/hold; so, how did MIPS fare?
A graph of the SPY price during that period is shown below (red line). After a very wild ride, the buy/hold strategy would have resulted in a gain of 43% during that time period (an average of about + 4.6% annually).
So, how would you have done using MIPS stock market timing systems in this period? Hold on to your hat, and see the results below from using MIPS during this period (results from actual verified signals after 11/05/2005; results prior to that date from back testing).
See the Graph Below:
Actually, you would have done quite well with MIPS3. During the time period below (2003-07/16/21), when the stock market (S&P 500) was up from $10,000 to $32,000, the MIPS3/MF model with a buy/short SPY strategy would have resulted in a gain of your inial investment of $10,000 to $82,000 (gain of about +720%) and the MIPS3/MF model with trading QQQ would have resulted in a gain in your mondy to $108,000 (gain of about 980%) !!!
HOW CAN MIPS POSSIBLY DELIVER THIS TYPE PERFORMANCE ?
Even though the above performance might look like "magic" to the average investor, the fat cats have been enjoying this type of performance for over 100 years.
Is it indeed magic? No, it is simply changing your trading strategy from "buying and holding" (buy/hold) to either (a) buying and getting out (buy/sell) or (b) buying and shorting (buy/short), AND having a stock market or etf market timing model to tell you when to buy/sell/short.
OK, so how does buy/short actually work? Well, first you need a good stock signal timing system (like MIPS) to tell you when the stock market is headed up and when it is headed down. You will invest smarter with a good, verified stock timing. Then, you simply need to be in long positions when the stock market is going up (Long Signal) and either (a) be out of the stock market (Cash Signal), or (b) be in short positions when the stock market is headed down (Short Signal). MIPS is a safe market trading strategy.
Show me!!
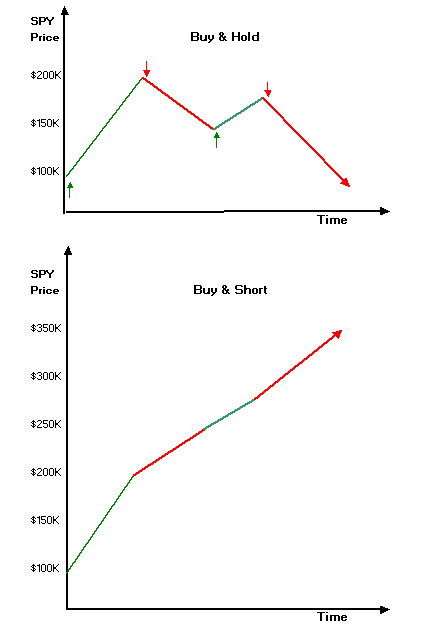
OK, let's look at a simple chart of stock market movements and how you would make money with the buy/short strategy.
See how the buy/short strategy would work in a perfect world. Of course, stock market timing systems like MIPS are not perfect, but they are 1,000 times better that going it alone.
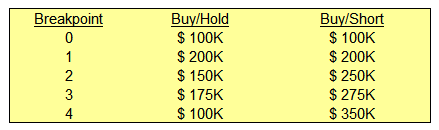
In the first of the graphs below, buy/hold SPY ETF & buy/short SPY ETF strategies would have resulted in the values at each breakpoint of those in the table immediately below. You can see that at every breakpoint, the SPY value with buy/short "ratchets" up by (a) being long when the market is going up, AND (b) being short when the market is headed down.
Real Life Performance Using MIPS3 Long/Short Strategy (MF) Does this seem unbelievable? Do you doubt that this could happen in real life? It not only can, it does several times over almost every 20-year period. For a real life view of this, let's look at the period between 11/20/2005 and 12/21/2010 (with MIPS verified signals for this time frame).
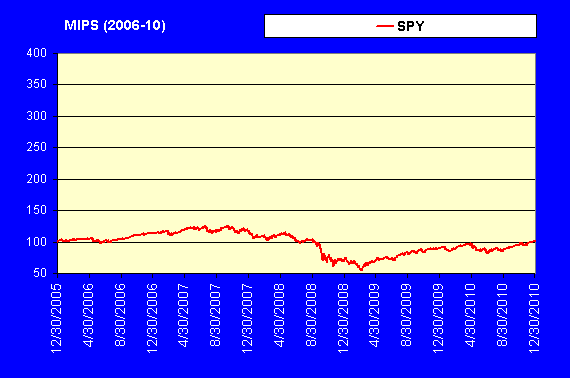
Top Graph - Buy/Hold SPY
In this time period, the SPY started with $100,000; grew by about 27% to $127,000; took a nose-dive in 2008 of over 50% to $60,000; and grew back to where it started ($100,000) on 12/20/2010. Big deal, 5 years and you would have ended up where you started (that is, you would not have made a penny). At least, with corporate bonds paying 5% during that time period, your portfolio would have grown to $127,500.
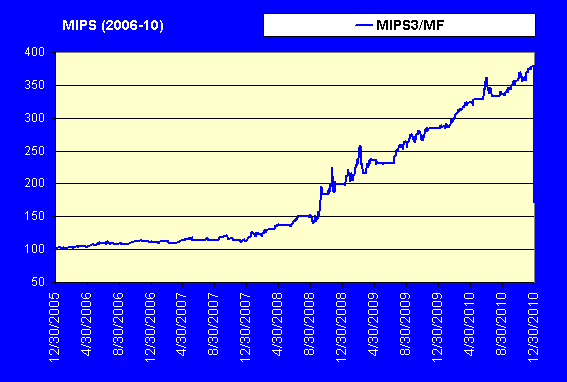
Bottom Graph - Buy/Short SPY (with MIPS3/MF)
The numbers in the 2nd chart below are real numbers, generated with the MIPS3/MF buy/short/cash strategy (using signals verified by TimerTrac.com). During the period between 11/20/2005 and 12/31/2010, using the MIPS3/MF model with a buy/short strategy, your portfolio that started at $100,000 would have grown steadily (almost no dips) over this five year period to $379,000 at the end (for a GAIN of 279%) !!!