Sunday, February 25 2018
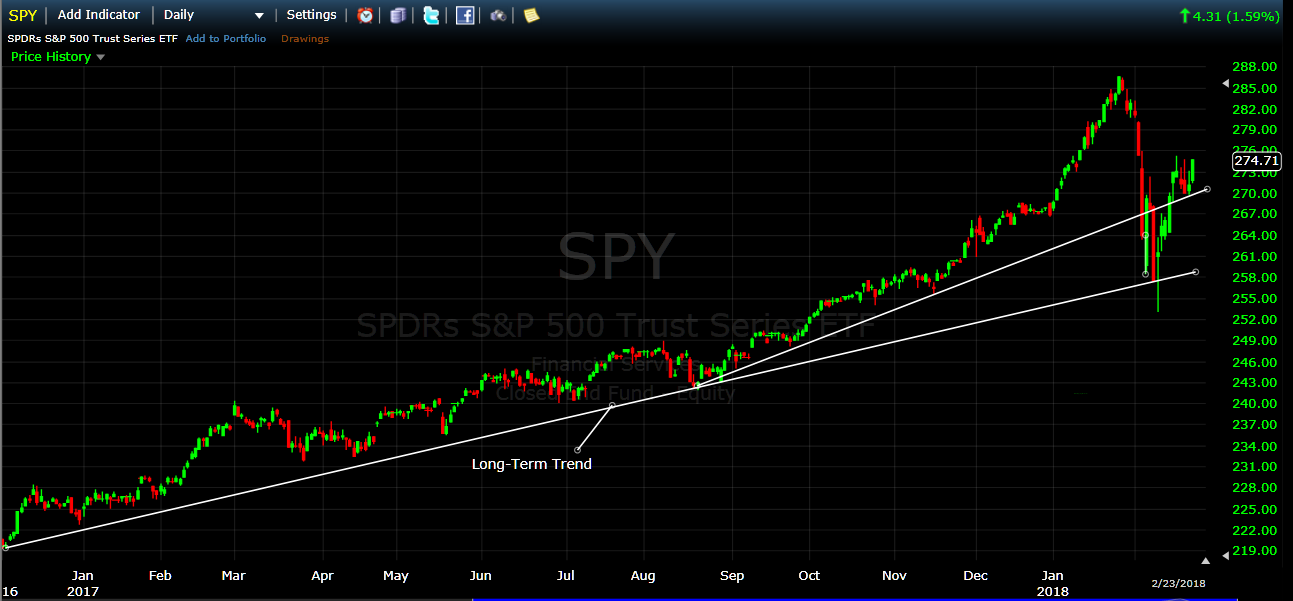
All investors were shocked by how fast the recent drop became an intraday "correction", and most were also shocked by how fast the market recovered. The Nasdaq has recovered about 80% of its drop and the S&P 500 (SPY) has recovered approx 65% (see chart immediately below).
In our last Blog (When is a Market Drop a "Big Drop") http://www.mistiming.com/blogs we mentioned that we thought the main reasons for this correction were rising bond yields, inflation scares, overbought markets, traders taking profits, the "fat kats" heading for the hills, etc. Most likely, this intraday correction was started by trading from very short-term institutional traders (not investors) taking profits after such a recent strong run-up.
At any rate, the SPY experienced a dramatic "one day key reversal" on 02/09/2018, and then it bounced off of its 200-day moving average with great force and formed a very bullish "up-hammer" pattern that day. Since then, the "turn-around" has recovered approximately 2/3rds (66%) of the drop.
So, where will the market go from here ???
We all know that none of us can answer that question, so let's look at what I think are the two most probable happenings.
1) The SPY could complete the V-Bottom and continue up from there. We believe that if this happens, the market will retain its bullish conditions and will continue up for the next several months. This, of course, would result from rising corporate profits, strong economy, strong job market, etc. Note: If the SPY does break up after completing its V-Bottom, it could come back temporarily to test its breakout level.
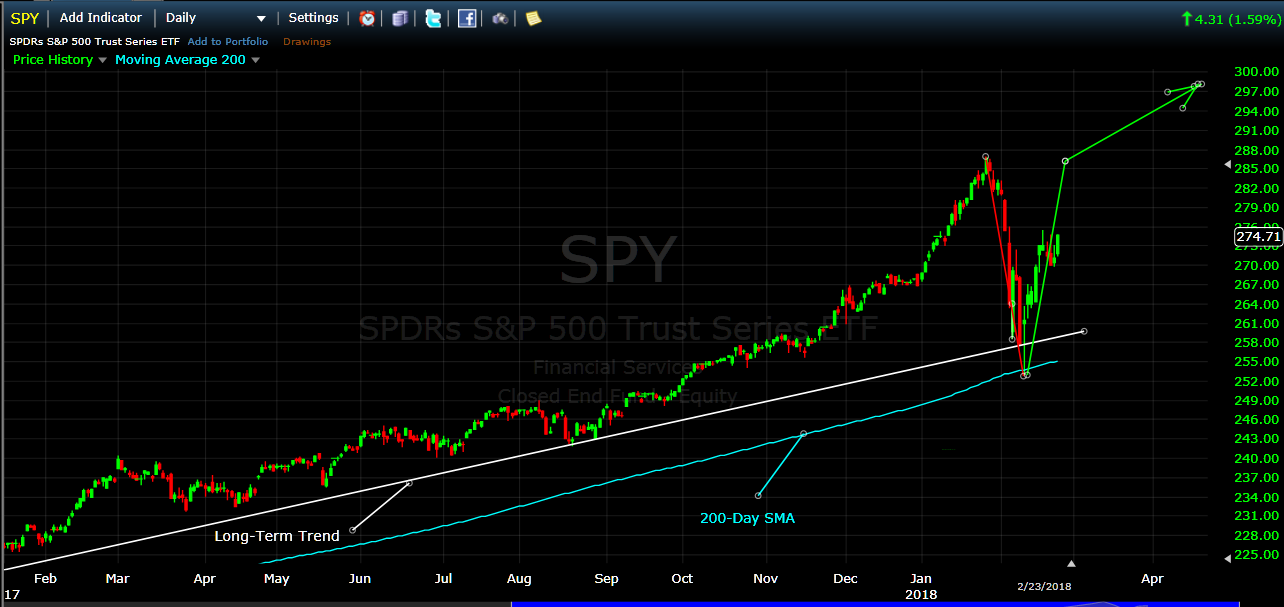
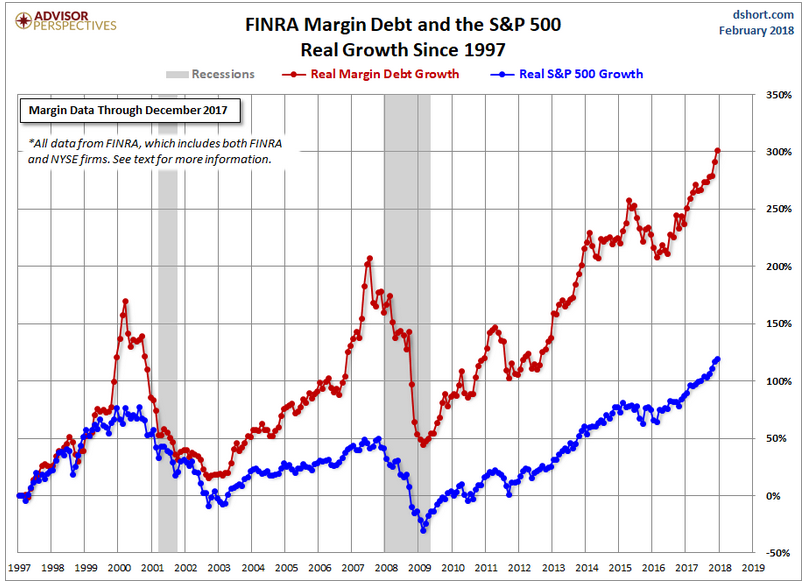
2) The SPY could go back to the all-time high where the correction started, and fall back into a full market crash. This would constitute what is called a "Double Top"; which is a proven, highly bearish pattern (1st graph below). If this actually happens in this market at this time, I believe that the major reasons would be the highly overbought market and the outrageously high margin debt at this time. In case you are not aware, the margin debt is basically the amount of money investors have "borrowed" to buy equities. When the margin debt is high, a strong pullback will force investors and traders to sell in order to pay down their debt. And, at this time, the market it is right up there with the highest levels in stock market history, and all market crashes have occurred at margin debt levels lower than it is now (see 2nd graph below). PS: This does not mean that high margin debt will indeed tank the market now, but it will be a strong catalyst somewhere along the way.

..
.
.
MARGIN DEBT
SO, WHAT DO WE DO NOW ???
If you are a relatively young person (say like under 35), you can make mistakes with your investment money now and still have a chance (at least a remote chance) to "make it back", so do whatever you want now. But, if you are over 40, or less than 15-20 years from retirement, you cannot make big mistakes now because you most likely do not have time to make it back even if you do the right things after your losses. And remember, the stock market experiences market crashes (drops of 40-65%) more often than once every decade (like in 1987, 2000, 2008 and ???). SO, TO GET THROUGH THIS ROUGH TIME, PLEASE USE MIPS OR FIND ANOTHER GOOD MODEL (OR MODELS) TO HELP YOU DECIDE WHEN TO BE INVESTED LONG OR SHORT OR BE IN CASH. And, if you do not know what to do, you can call me and I will tell you about MIPS and any other model that you may be considering.
MIPS PERFORMANCE IN DOWN MARKETS, including now !!!
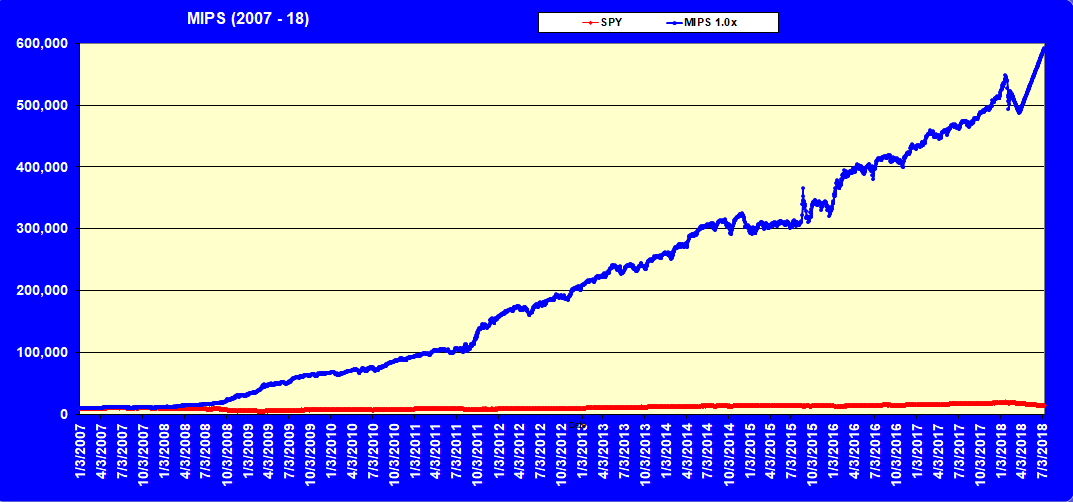
To help us understand what MIPS is most likely to do if the market drops 25% straight down over the next few months, we tested MIPS with many of its most reliable "predictive" algorithms to show us what the most likely outcome would be (see graph below). Results: MIPS would head down about 10% from where it is now, then climb back over 20%.
.
.
MIPS3's actual performance in 2008 (verified by TimerTrac.com)
MIPS3 +140%
SPY - 60%
PLEASE DO NOT TAKE A CHANCE NOW BY YOURSELF !!!
Best Wishes...
Paul Distefano, PhD
CEO / Founder
MIPS Timing Systems, LLC
281-251-MIPS(6477)
Saturday, February 17 2018
In the last few weeks, we have seen the market drop what appears to be rather dramatically; e.g., over 10% in one week (see graphs below). There are plenty of reasons being shared in the media for this, such as raising bond yields, inflation scares, overbought markets, traders taking profits, the "fat kats" heading for the hills, etc. Most likely, this mini-crash was started by trading from very short-term institutional traders (not investors) taking profits after such a recent strong run-up. This behavior has almost dominated the news, and has resulted in what could be called "panic" behavior in the markets.
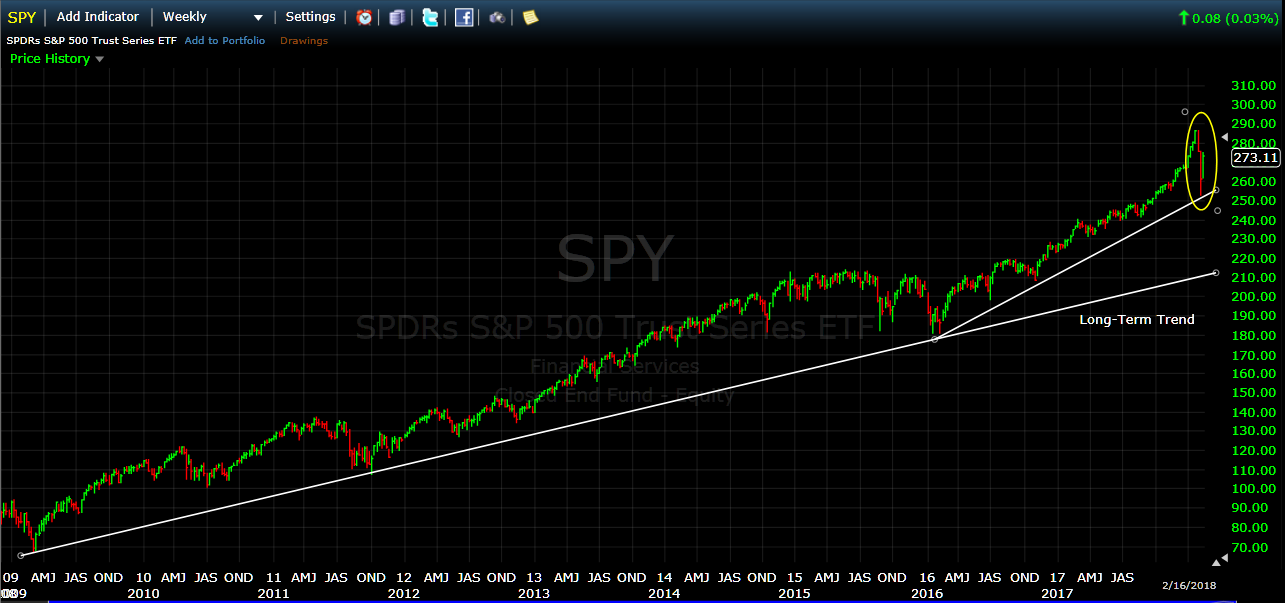
One way to put this in perspective is to look at the "long-term" view of the SPY compared to the "drop" discussed above (kind of like looking at the extent of a forest fire from an airplane). As you will see in the graph below, the SPY dropped about 10% in the last several weeks; but over the last 9 years, it has dropped over 15% several times, and droped between 6-8% many times without much fanfare. What makes this drop different is that it happened quickly (and with two daily drops in the Dow in excess of 1000 points each !!!).
So, as you can see below with all things considered, the "drop" does not seem to be as bad as it has been made out to be. We are very proud that the MIPS models were not sucked into issuing a Cash or Short signal.
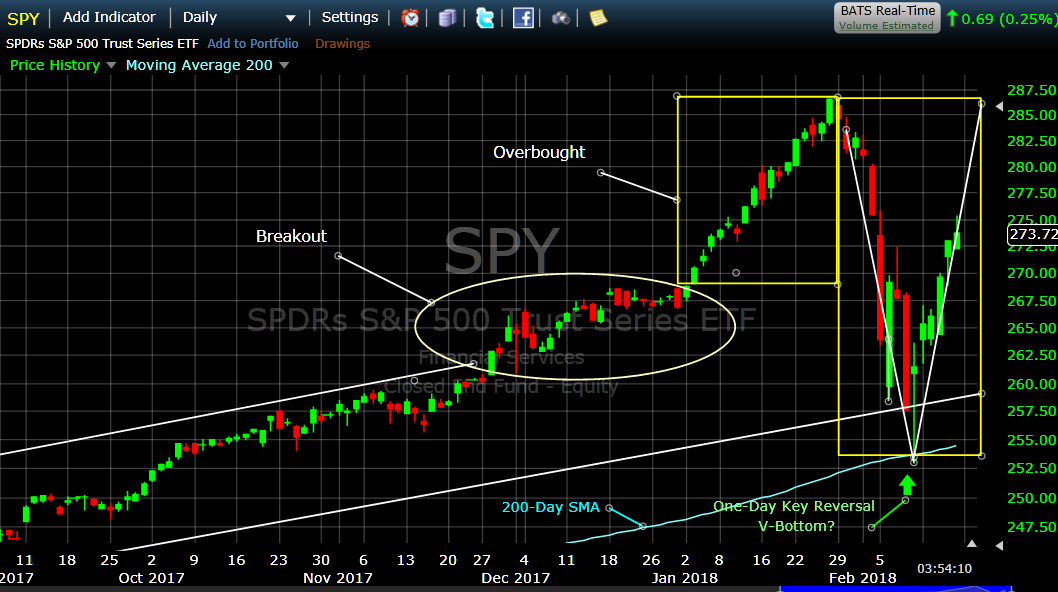
In fact, we now believe that the recent "drop" was simply what is called a "V-Bottom" pattern (see below).
A V-Bottom pattern is one where:
1) the market falls quickly in an almost straight line,
2) it almost always ends the drop with a dramatical "one day key reversal", and
3) it goes up in a path that is very similar to the path down.
This V-Bottom in Greater Detail
I have always believed that V-Patterns are formed from the trading by very short-term traders with an amazing amount of money that trade the cash in the accounts of the biggest of the big "fat kats" (Morgan Stanley, Goldman Sachs, Pimco, etc). They almost immediately dump when they have big gains to protect and when they even "smell" a big drop coming, with little or NO regard for what they think may have perpetrated the drop. Believe me, when these guys trade the volume soars and the prices move accordingly. And, I have always believed that the reason the recovery path looks almost just like the drop path is because, after the smoke clears, these traders are buying back what they sold near the prices where they sold (see more detailed graph below).
Also, please notice that on 02/09/2018, the SPY bounced off of its 200-day moving average with great force and formed the very bullish "Up- Hammer" pattern that day.
BTW - The reason that the MIPS models DID NOT issue a Cash or Short Signal during this drop period is because our models have "Relativity" algorithms built in (as opposed to just absolute algorithms). This means that the MIPS models put more weight on % changes relative to past performance rather than just the change itself.
The net result of this would be: If the market has gone up substantially in the last 30-90 days, MIPS may ignore a 6-8% drop with no signal change; whereas if the market had been relatively flat or had only had smallish gains in this time period, the MIPS models most likely would have signaled a change even on a 4-6% drop.
Let's wait for MIPS to tell us what to do next...
- and remember, no new signal on any give day is in effect a signal to stay put.
Good Trading...
Paul Distefano, PhD
CEO / Founder
MIPS Timing Systems, LLC
Houston, TX
281-251-MIPS(6477)
support@mipstiming.com
Thursday, February 08 2018
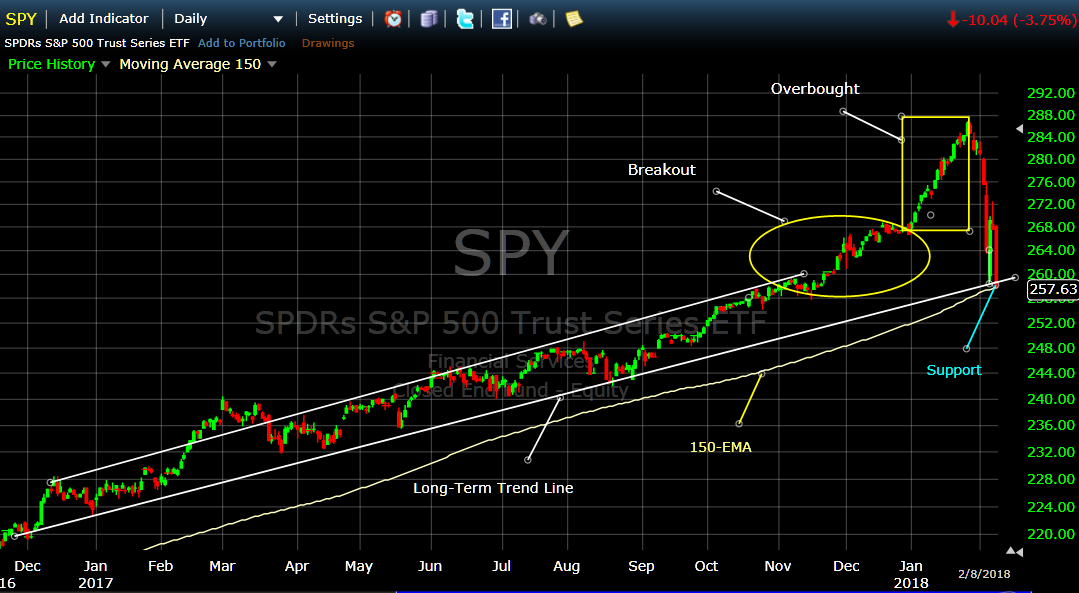
Today was another terrible day for the stock market. The big drop today drove all of the major indices into "Correction" territory (between a -10% and -20% drop). For most of us, it's pretty tough to experience a drop like this over just a few days.
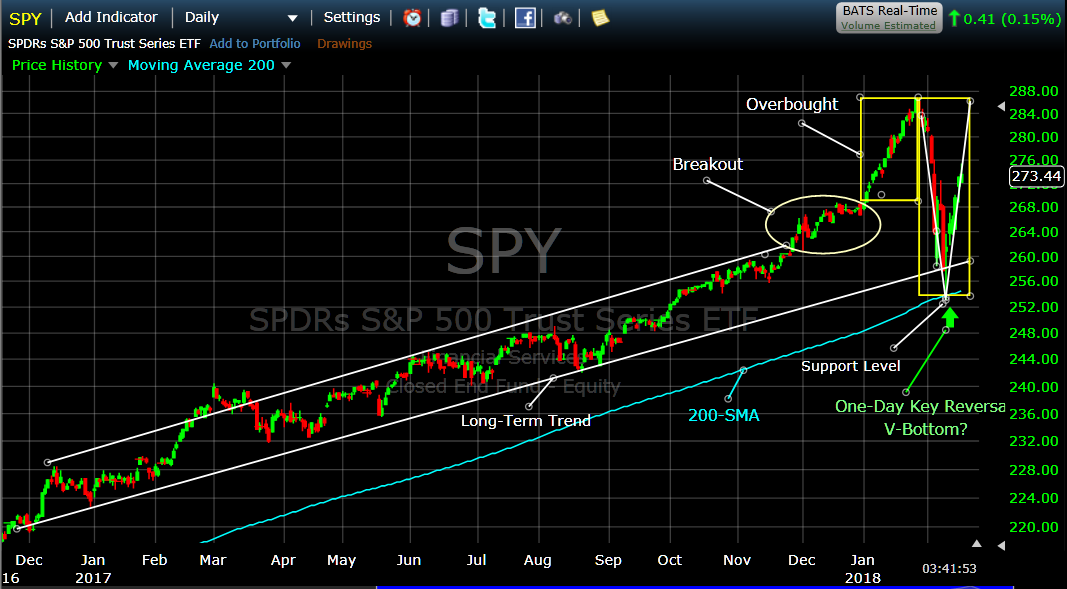
Without trying to figure out how we got into this mess (rising interest rates, inflation worries, overbought markets, etc), let's try to figure out where the market is going from here. Tomorrow's market performance is very important and that is why I designate tomorrow as a "Critical" day (see graph below).
As you can see, the drop in the market since the end of Jan 2018 has been steep and vicious; as it resulted in about a -10% loss for all of the major indices. Thankfully, today's drop in the SPY shown below held just above its "support" level of $257.6/share on both the Long-Term Trend Line and the 150-day EMA. That is why tomorrow's market performance is critical. If this "support" level does not hold, this bull market could be in trouble (at least, short-term). For example, the only thing left to stop this drop now is the 200-day EMA; and I surely do not want to go there.
Of course, these commonly used "indicators" are a very small part of the MIPS models. But, they are interesting to watch, mainly because many other quantitative models rely 100% on several of them (NOT recommened).
Even though MIPS seems to be on the verge of triggering a Cash or Short signal, anything can happen.
So, stay tuned to MIPS...
Paul Distefano, PhD
MIPS Timing Systems, LLC
Houston, TX
281-251-MIPS(6477)
==================================================================.
<<< Yesterday's MIPS Blog >>>
Wow! What a nerve-racking market we have had in the last few trading days. As of today's date, the S&P 500 is close to "giving back" all of the gains it made in 2018.
Seems like everyone wants to know, "Is this a relatively small "dip" or a big "drop", as in an official correction? Or even, is this the beginning of a full-fledged market crash.
I am very comfortable that MIPS would protect us from the "sting" of a crash (as in 2008, shown below), and I don't believe this is even in the cards at this time. The only "indicator" that I know that works 100% of the time is that market crashes DO NOT happen during strong economies with rising corporate profits. We have both at this time, and expect them to continue.
If I am correct above, this leaves us with either a smallish dip or a correction. If we are in for a smallish dip, this has already happened (-9%) and the market should head back up for a while (for about as long as our economy stays strong). But, we do not want the economy to get overheated, because this will cause the Fed to stick their nose in and screw things up by overreacting (like they almost always do).
I think we all know (or believe) that the two culprits that have caused the fast dip in market prices so far have been the very highly "overbought" market and the Fed's plans for interest rate hikes.
Let's look at the dip in the market a little closer and see how bad it actually has been before we dwell on the reasons for the drop and how we are going to protect our portfolios now (see graph immediately below).
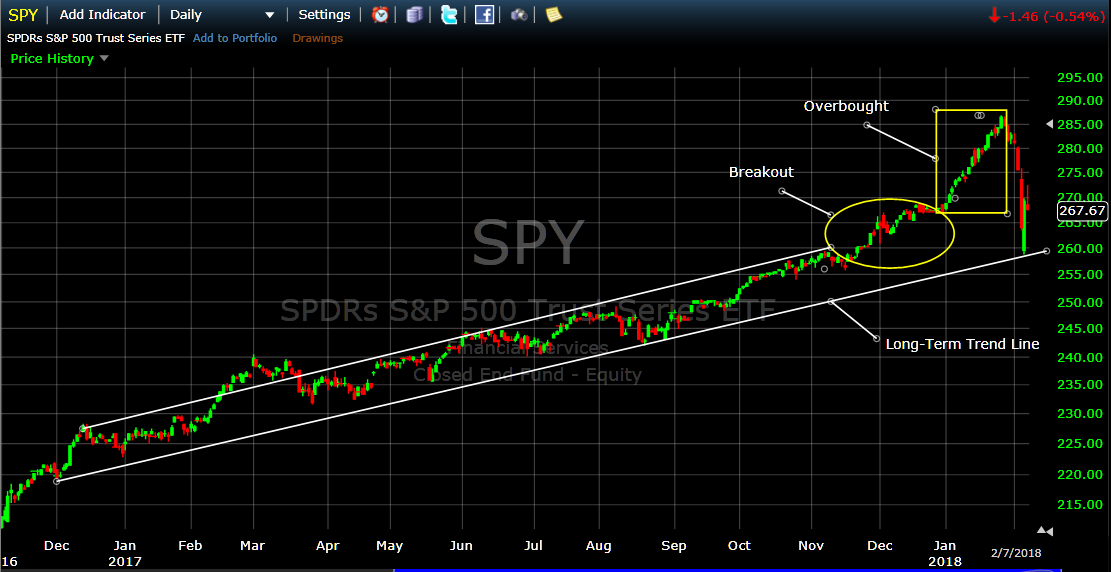
1) From Dec'16 to Nov'17 the SPY moved in a "near perfect" long-term up-channel.
2) In mid-Nov'17, the SPY picked up steam and moved above the upper line in the channel.
3) Between Jan 1, 2018 and Jan 26, 2018 the SPY took off like it was launched like a rocket.
4) Most investors knew this would come to an end, but not when.
5) Almost all pure reversion-to-the-mean models and algorithms were warning to get out; but
trend following models (like MIPS) usually would not trigger a cash or short signal as long
as the SPY remained above the long-term trendline (along with what the other indicators
and algorithms in the model were advising).
As you know (and can see below), the SPY dipped on Jan 29, 2018 and then dropped all the way
down to the long-term trendline on Feb 5th, and bounced back up some on Feb 6th. The SPY held
above the trendline again today (Feb 7th). Most likely, the SPY will again "test" the long-term
trendline; and, of course, it is of utmost importance for the SPY to remain above the trend-line.
Otherwise, look for trouble.
Note: The graph below is using Daily Bars.
So, as we can see, the market could go either way at this time and MIPS members want to know if MIPS can react fast enough to protect us from losing big money (or even help us to make money in a down market).
This leads to the question, "Can MIPS respond quickly to a drop of 8-9%?"
The simple answer is that MIPS absolutely, positively CAN (and does) react to drops of -9% or less,
but it depends on the market circumstances at that time.
- MIPS can react to a 4-5% drop if the market has been relatively flat or growing very slowly, but
- MIPS will not react quickly to a 8-9% drop if the market has been growing fast and strong (as now)
- this decision is made by "relativity" algorithms that are built into the MIPS computer code
- and, these algorithms greatly reduce the probability of getting whipsawed.
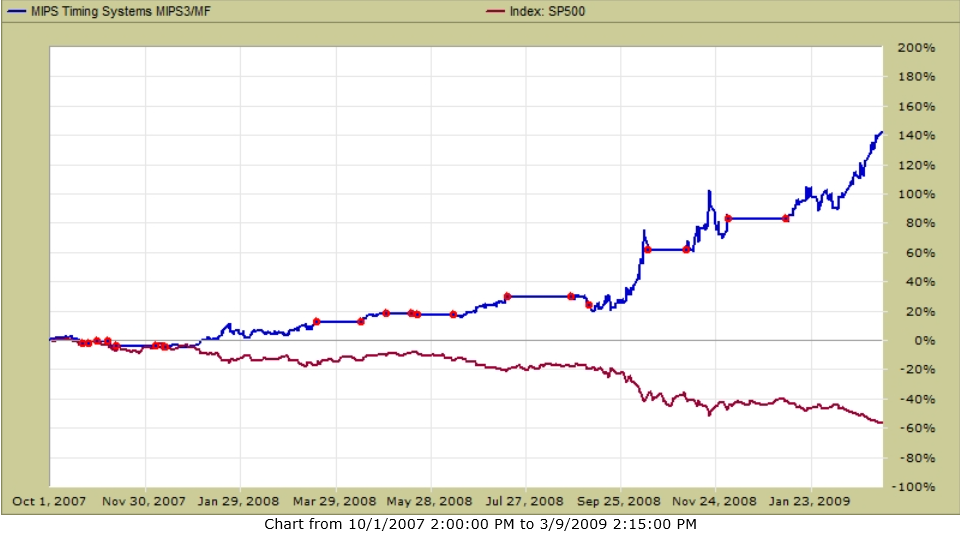
To show this, look at the actual MIPS3 signals below in the stock market Crash of 2008
- this "Crash" started at the end of Oct 2007 and recovered in mid-March 2009.
In the graph below from TimerTrac.com, you can see that:
- MIPS issued a critical "short signal" in mid-Dec 2007
- and, this was after about a -5% drop
- during this time, the SPY dropped -60% and MIPS3 was up +140% (verified by TimerTrac.com).
PS - this performance resulted from trading the SPY Long/Short/Cash with no leverage.
Note: Red dots designate MIPS3 trade Signals
Hope this helps !!!
Paul Distefano
-- Contact Info ---
Paul Distefano, PhD
Founder/CEO
MIPS Timing Systems, LLC
Houston, TX
281-251-MIPS(6477)

www.mipstiming.com
support@mipstiming.com
Wednesday, February 07 2018
Wow! What a nerve-racking market we have had in the last few trading days. As of today's date, the S&P 500 is close to "giving back" all of the gains it made in 2018.
Seems like everyone wants to know "Is this a relatively small "dip" or a big "drop", as in an official correction? Or even, is this the beginning of a full fledge market crash.
I am very comfortable that MIPS would protect us form the "sting" of a crash (as in 2008, shown below), and I don't believe this is even in the cards at this time. The only "indicator" that I know that works 100% of the time is that market crashes DO NOT happen during strong economies with rising corporate profits. And, we have both at this time.
If I am correct above, this leaves us with either a smallish dip or a correction. If we are in for a smallish dip, this has already happened (-9%) and the market should head back up for a while (for about as long as our economy stays strong). But, we do not want the economy to get over-heated, because this will cause the Fed to stick their nose in and screw thing up by overreacting (like they almost always do).
I think we all know (or believe) that the two culprits that have caused the fast dip in market prices so far has been the very highly "overbought" market and the Fed's plans for interest rate hikes.
Let's look at the dip in the market a little closer and see how bad it actually has been before we discuss the reasons for the drop and how we are going to protect our portfolios now (see graph immediately below).
1) From Dec'16 to Nov'17 the SPY moved in a "near perfect" long-term trend.
2) In mid-Nov'17, the SPY picked up steam and moved above the upper line in the channel.
3) Between Jan 1, 2018 and Jan 26, 2018 the SPY took off like it was launched as a rocket.
4) Most investors knew this would come to an end, but not when.
5) Almost all pure reversion-to-the-mean models and algorithms were warning to get out, but
trend following models (like MIPS) usually would not trigger a cash or short signal as long
as the SPY remained above the long-term trendline (along with what the other indicators
and algorithms in the model were advising)
As you know (and can see below), the SPY dipped on Jan 29, 2018 and then dropped all he way
down to the long-term trendline on Feb 5th, and bounced back up some on Feb 6th. The SPY held
above the trendline again today (Feb 7th). Most likely, the SPY will again "test" the long-term
trendline; and, of course, it is of utmost importance for the SPY to remain above the trend-line.
Otherwise, look out for trouble.
Note: The graph below is using Monthly Bars.

So, as we can see, the market could go either way at this time and MIPS members want to know if MIPS can react fast enough to protect us from losing money (or even help us to make money in a down market)
This leads to the question "Can MIPS respond quickly to a drop of 8-9%?"
The simple answer is that MIPS absolutely, positively CAN (and does) react to drops of -9% or less,
but it depends on the market circumstances at that time.
- e.g., MIPS can react to a 4-5% drop if the market has been relatively flat or growing very slowly, but
- MIPS will not react too quickly to a 8-9% drop if the market has been growing fast and substantially
(as in the last several months)
- this decision is made by "relatively" algorithms that are built into the MIPS computer code
- and, these algorithms GREATLY reduce the probability of getting WHIPSAWED
To show this, look at the actual MIPS3 signals below in the stock market CRASH of 2008
- this CRASH started at the end of Oct 2007 and recovered in mid-March 2009
In the graph below from TimerTrac.com, you can see that:
- MIPS issued a critical "short signal" in mid-Dec 2007
- and, this was after about a -5% drop
- during this time, the SPY dropped -60% and MIPS3 was up +140% (verified by TimerTrac.com)
PS - this performance resulted from trading the SPY Long/Short/Cash with no leverage
Note: Red dots designate MIPS3 trade Signals

Hope this helps !!!
Paul Distefano
-- Contact Info ---
Paul Distefano, PhD
Founder/CEO
MIPS Timing Systems, LLC
Houston, TX
281-251-MIPS(6477)

www.mipstiming.com
support@mipstiming.com
|


