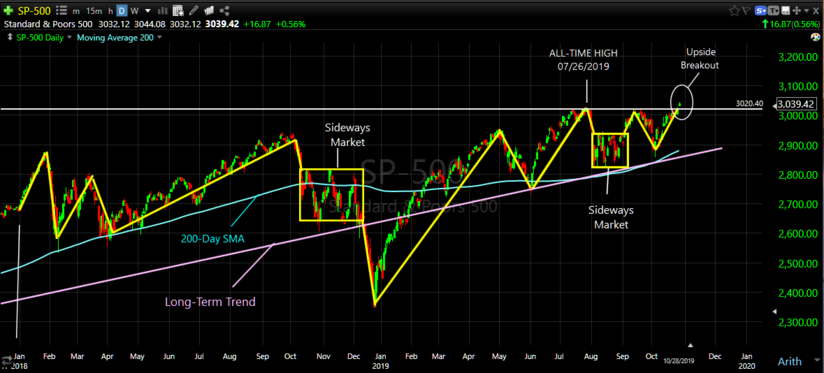
After all of the "good news" in the last two years (low unemployment, higher corporate profits, etc.), the S&P 500 ETF (SPX) made an All-Time New High today (10/28/2019). See the "Upside Breakout" on the top right in the graph below.
As you can see in the graph immediately below, the "ride" in 2018-19 has been a rocky one, with V-Bottoms, Zig-Zag, and Sideways Markets almost everywhere. It might not be obvious, but it is extremely difficult for quant models to maneuver through patterns like those below without getting whipsawed. In spite of all of this, the S&P 500 has managed a 13.6% gain so far in these last two years.

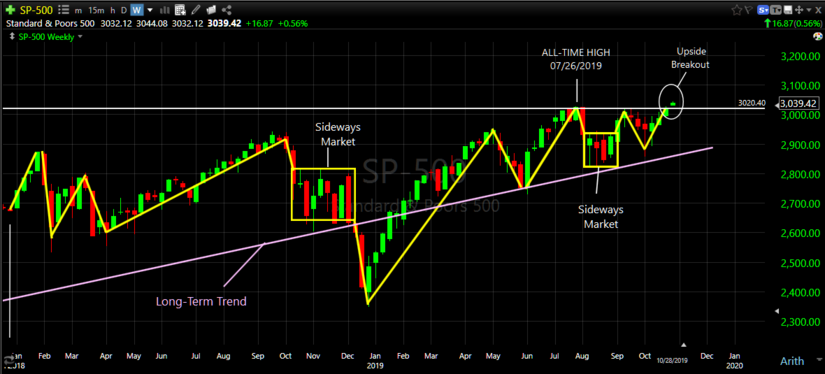
A "cleaner" way to look at the SPX over these two years is to back up and look at the same time frame with Weekly bars (below) instead of Daily bars (above). With a "higher view", the patterns become easier to see and read.

What's Next ???
The dangerous part of all Blogs regarding the stock market (or everything else for that matter) is trying to predict the future. From my view point (not MIPS') the economical part of the matter looks short-term solid (though slipping some), but the financial part (the Fed) and the political parts (tariffs, impeachment, etc.) look very shaky. Which will be in command in the next few weeks is hard to predict; but if anything goes astray on the financial or political parts, the market may drop fast and far. As far as a market "crash"? No, but very scary and potentially costly.
For help with the above, keep a constant eye on the MIPS Signals.
- BTW, all MIPS models are still Long from their 9/05/2019 signals.
Good Trading !!!
Paul Distefano, PhD
CEO / Founder
MIPS Timing Systems, LLC
281-251-MIPS(6477)