Monday, May 30 2016
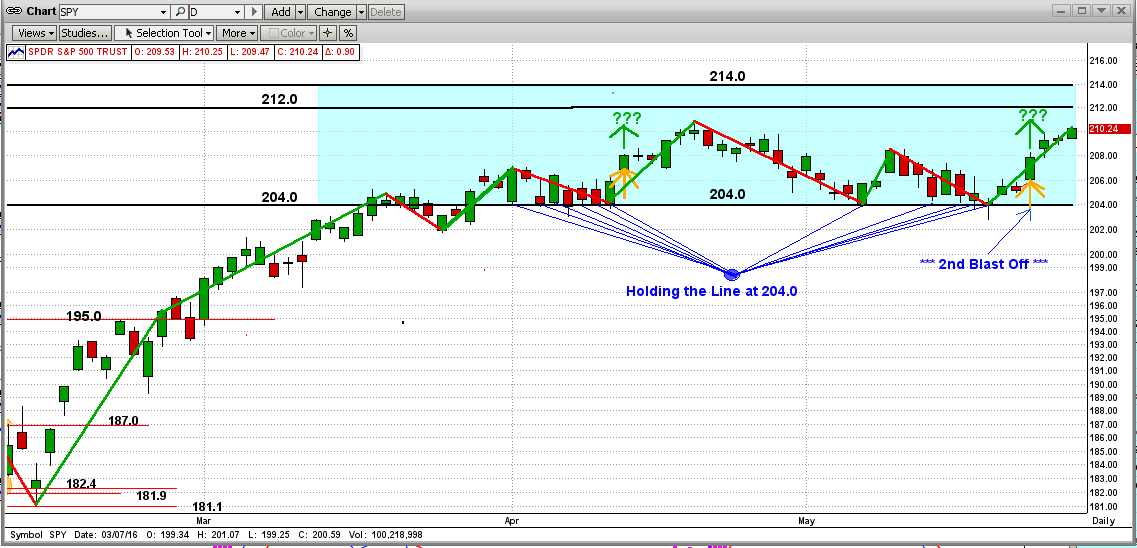
After holding again at its very strong 204.0 support level, the SPY "Blasted-Off" again last Tuesday (5/24/16), heading for its all-time closing high at 213.5 (the intraday high is 214.0). If the market breaks above 214.0 (approx. 2140 on the S&P 500 Index), with some degree of strength, we could easily get a 5-10% rally thereafter.
Two things stand in the way of this:
- one is the Fed (surprise, surprise) and
- the other is the SPY's extremely strong resistance at 214.0. This is a very tough one to call, but we have high confidence that MIPS will pick up the trend quickly.
Stay tuned...
Thursday, May 19 2016
The Fed's big mouth Yellin is yelling and the market is running for the hills. On economic news that should have been good for the market, the Fed once again managed to make it bad news by insinuating the re-start of rate hikes and possibly even more quantitative easing (which would become QE4).
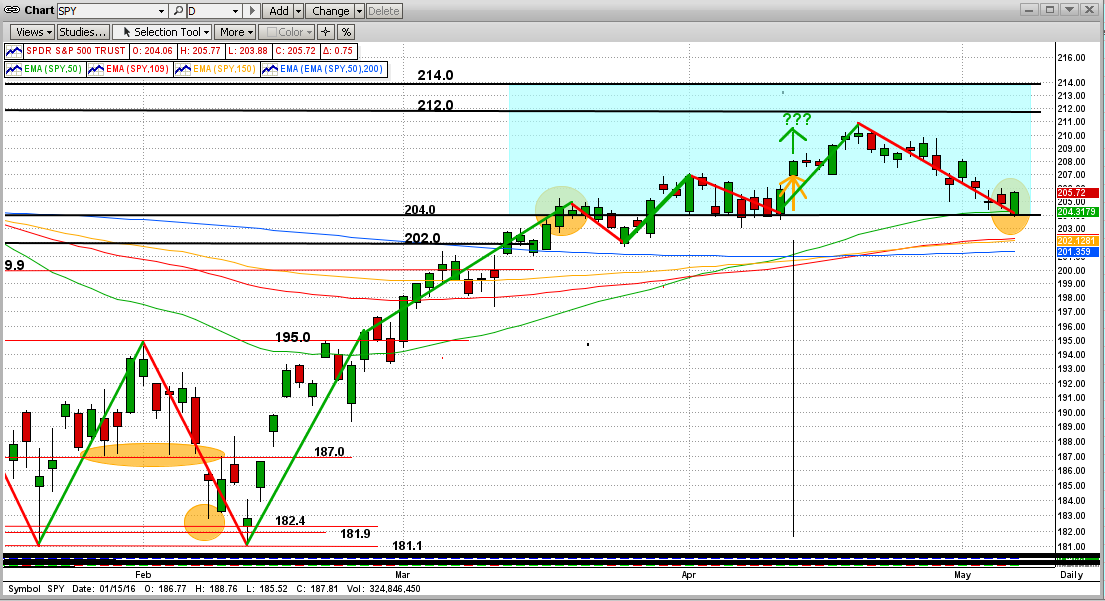
Since the beginning of 2016, the Bulls have fought off all market drops, and the S&P 500 is up for the year. In the last 2 months alone, the Bulls have offered very strong support at 204.0 on the SPY. To be exact, the SPY has amazingly hit and bounced up off of its 204.0 downside support level 12 times in the last two months (see graph below)!!!
We believe that the SPY "break-out" from 204.0 will be volatile and could lead to a major move up or down (i.e., new highs or a market crash). Or course, none of us know for sure which way the market will go from here, but we believe that MIPS will figure it out quickly. Stay tuned and watch closely !!!
Sunday, May 15 2016
Right above the 2nd graph below, we just added this:
Note: MIPS does not get "fooled" by the lag mentioned above and has called (and should continue to call) the drops/recoveries long before a single indicator like PRICE would. In 2008, MIPS was up over 50% !!!
-------------------------------------------------------------------------------------------------------------------------------
MIPS Members:
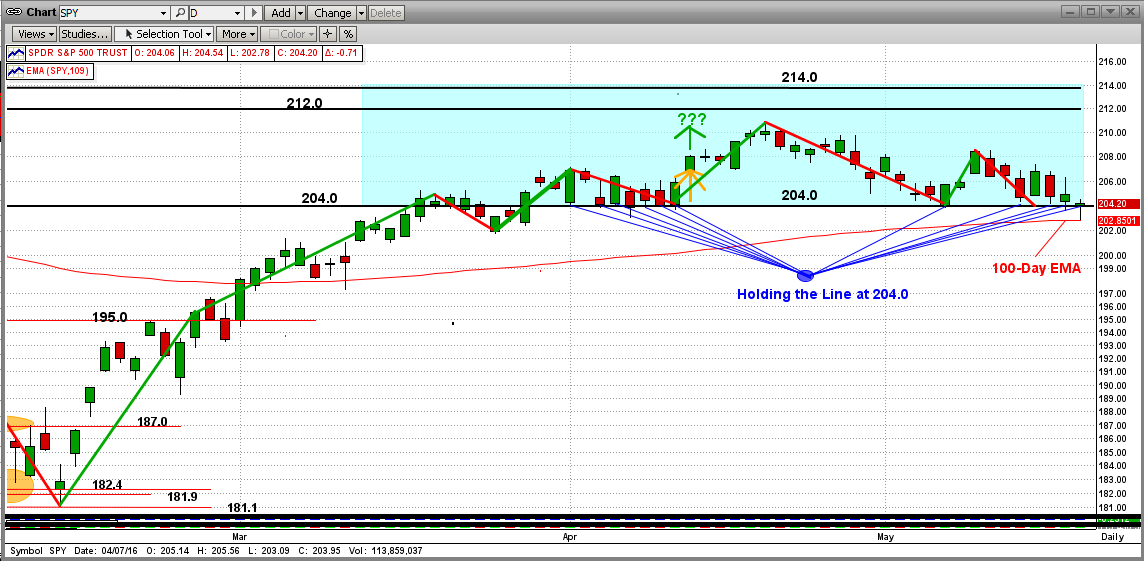
We are all wondering where this market will go from here. On Friday of last week, the SPY closed very near a critical point; almost right on the 204.0 support level and dead-on the 50-day EMA (green line in graph below). Of course, in the short-term, the market can move either way from here. We will rely on MIPS to tell us how to trade this market now.
LONG TERM...
At this time, after a 7-year Bull Market, it is interesting and prudent to start analyzing the longer-term outlook. Consider this ...
There are thousands of things that make the stock market move up and down all day long (daily cycles). And, there are others that affect what the market does on a longer-term basis; such as on daily-weekly cycles (short-term), monthly-quarterly cycles (intermediate-term), and annual cycles (long-term).
"Things" that affect short and intermediate-term cycles, (fundamental and technical) are overwhelming, such as:
- natural disasters (earthquakes, tsunamis, etc.)
- terrorist attacks
- foreign crisis (Greece, China, etc)
- tech leader failure (Apple, Amazon, etc.)
- economic growth
- consumer prices
- inflation
- stock values (extreme P/E ratios)
- companies earnings/profits
- Fed Action
- interest rates
- quantitative easing
- dangerously low oil prices
- sentiment
- etc., etc., etc.
Short/Intermediate Term
The above are impossible to predict, but the impact on the market from "all of the above" combined can be measured and analyzed on an intermediate-term basis. That is what MIPS does for us. MIPS uses applied mathematics, pattern recognition, artificial intelligence, and common sense to tell us if the intermediate-term trend is moving up or down. Furthermore, each decision is analyzed in light of what MIPS sees the "big guys" doing (that is, institutional investors, like Morgan Stanley, Goldman Sachs, etc.). MIPS does this by "weighting" market changes by trading volume, using our proprietary "volume-weighted data". Basically, this means that market changes on high volume have a greater impact on decision than market changes on low volume. Of course, since high volume can only come from the big guys, we are basically tracking what the big guys are doing (high volume is like their "foot prints" in the sand).
Long-Term
The long-term trend should be a little easier to predict because of one single indicator. This indicator is NOT a technical indicator. Rather, it is a core fundamental fact which always shows which way the market should/will be moving. I say "should" because it sometimes takes a while to "sink in" (lag); and I say "will" because the market WILL ultimately follow this indicator.
Of course, this is not something that I made up or discovered. Big, smart investors like Warren Buffett have followed this fundamental indicator throughout their entire careers. It's not a new one either, as it was emphasized in Benjamin Graham's book "The Intelligent Investor" in 1949. This non-magical indicator is companies' PROFITS.
Ultimately, the long-term trend in stock prices is driven almost 100% by profits, but sometimes with a few months lag. [I believe that stock prices start moving up or dropping a few months before profits move up or down because the fat kats (CEOs, top management, board members, institutional investors, etc.) know in advance what direction their companies' quarterly profits will be, and they (and their family/friends) take action long before the profits are released to the public.]
Note: MIPS does not get "fooled" by the lag mentioned above and has called (and should continue to call) the drops/recoveries long before a single indicator like PRICE would. In 2008, MIPS was up over 50% !!!
See the graph below (from StockCharts.com and www.RealInvestmentAdvice.com)

BEWARE
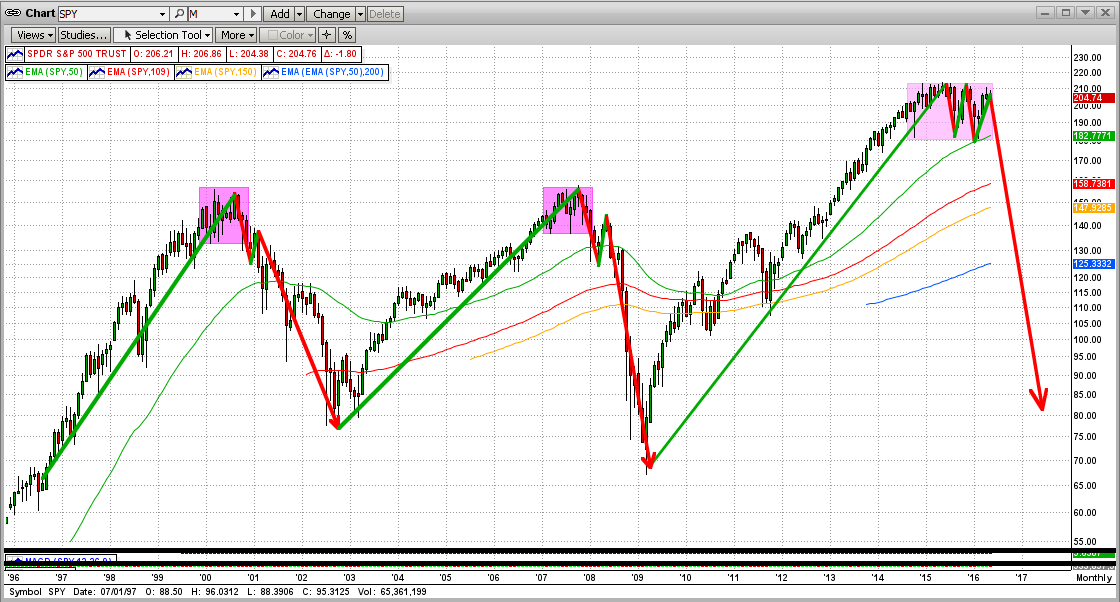
In the graph above, you can see that PROFITS "peaked" at the end of 2015, and have been DROPPING for over 1 year now. I believe that the Fed, and only the Fed, has been keeping stock prices high throughout 2015 with quantitative easing and extremely low interest rates. This is not good and cannot continue to happen forever. When the Fed's "tricks" no longer have a positive impact on stock prices, and if the US economy does not improved significantly, we will most likely have a drop in the stock market like in 2000 and 2008 (see graph below).
Good trading ...
Sunday, May 15 2016
We are all wondering where this market will go from here. On Friday of last week, the SPY closed very near a critical point - almost right on the 204.0 support level and dead-on the 50-day EMA (green line in graph below). Of course, in the short-term, the market can move either way from here. We will rely on MIPS to tell us how to trade this market now.
LONG TERM...
At this time, after a 7-year Bull Market, it is interesting and prudent to start analyzing the longer-term outlook. Consider this ...
There are thousands of things that make the stock market move up and down all day long (daily cycles). And, there are others that affect what the market does on a longer-term basis; such as on daily-weekly cycles (short-term), monthly-quarterly cycles (intermediate-term), and annual cycles (long-term).
"Things" that affect short and intermediate-term cycles, (fundamental and technical) are overwhelming, such as:
- natural disasters (earthquakes, tsunamies, etc.)
- terrorist attacks
- foreign crisis (Greece, China, etc.)
- tech leader failure (Apple, Amazon, etc.)
- economic growth
- consumer prices
- inflation
- stock values (extreme P/E ratios)
- companies earnings/profits
- Fed Action
- interest rates
- quantitative easing
- dangerously low oil prices
- sentiment
- etc., etc., etc.
Short/Intermediate Term
The above are impossible to predict, but the impact on the market from "all of the above" combined can be measured and analyzed on an intermediate-term basis. That is what MIPS does for us. MIPS uses applied mathematics, pattern recognition, artificial intelligence, and common sense to tell us if the intermediate-term trend is moving up or down. Furthermore, each decision is analyzed in light of what MIPS sees the "big guys" doing (that is, institutional investors, like Morgan Stanley, Goldman Sachs, etc.). MIPS does this by "weighting" market changes by trading volume, using our proprietary "volume-weighted data". Basically, this means that market changes on high volume have a greater impact on decision than market changes on low volume. Of course, since high volume can only come from the big guys, we are basically tracking what the big guys are doing (high volume is like their "foot prints" in the sand).
Long-Term
The long-term trend should be a little easier to predict because of one single indicator. This indicator is NOT a technical indicator. Rather, it is a core fundamental fact which always shows which way the market should/will be moving. I say "should" because it sometimes takes a while to "sink in" (lag); and I say "will" because the market WILL ultimately follow this indicator.
Of course, this is not something that I made up or discovered. Big, smart investors like Warren Buffett have followed this fundamental indicator throughout their entire careers. It's not a new one either, as it was emphasized in Benjamin Graham's book "The Intelligent Investor" in 1949. This non-magical indicator is companies' PROFITS.
Ultimately, the long-term trend in stock prices is driven almost 100% by profits, but sometimes with a few months lag. [I believe that stock prices start moving up or dropping a few months before profits move up or down because the fat kats (CEOs, top management, board members, institutional investors, etc.) know in advance what direction their companies' quarterly profits will be, and they (and their family/friends) take action long before the profits are released to the public.]
See the graph below (from StockCharts.com and www.RealInvestmentAdvice.com)
BEWARE
In the graph above, you can see that PROFITS "peaked" at the end of 2015, and have been DROPPING for over 1 year now. I believe that the Fed, and only the Fed, has been keeping stock prices high throughout 2015 with quantitative easing and extremely low interest rates. This is not good and cannot continue to happen forever. When the Fed's "tricks" no longer have a positive impact on stock prices, and if the US economy does not improved significantly, we will most likely have a drop in the stock market like in 2000 and 2008 (see graph below).
Good trading ...
Sunday, May 08 2016
MIPS Members:
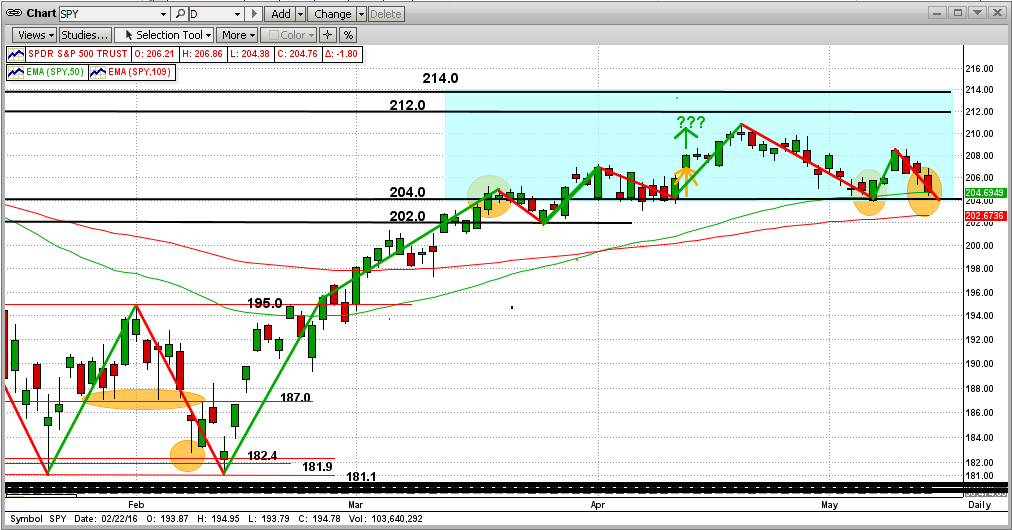
Just as it appeared that the Bulls had broken out to the upside on 4/13/2016 to win the "Resistance Battle" of the SPY at 204.0, the Bears came back strong. The Bulls carried the SPY up to the 211.0 level, but the Bears pushed them back again to test 204.0.
The Bulls fought hard and held above the very strong 204 Resistance Level, which happened to also be the 50-Day EMA. This was a VERY bullish day !
Does this mean the market will be up from here? Absolutely not. It does mean, however, that the Bulls did find the strength to momentarily resist the downward push from the Bears when the market hit the ultra-critical 204.0 resistance.
This market could go either way from here (lots of good reasons now for both directions).
Let's wait for MIPS to tell us what to do !!!
|


