We sent out the email below at 1:24am today. Since then, we have been inundated by MIPS members asking us to show the "backtested" performance results from the newest MIPS3 and MIPS4 "Blaster" models that we referred to in the last sentence in the last paragraph in the previous email below.
I.) Original - That last sentence in the last paragraph read:
"Backtesting shows that the current MIPS3 and MIPS4 "Blaster Series" models would have produced results more than three times better than the results below from our original model. And, the maximum drawdowns would have been much smaller (14% vs. 20%)"
II.) Update - As you can see in the graph immediately below, the last sentence should have read:
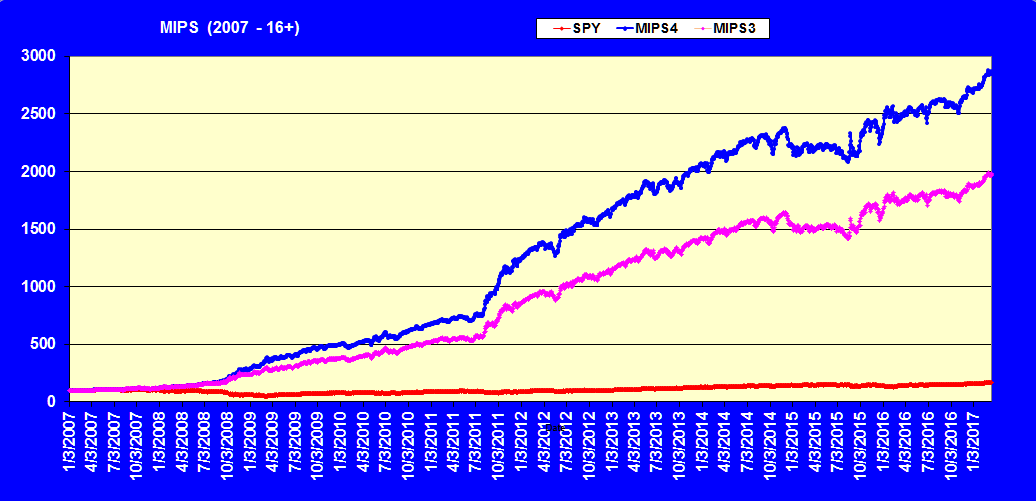
"Backtesting shows that the current MIPS3 and MIPS4 "Blaster Series" models would have produced results of 4 times and 5 times better (20 and 28 times their money, respectively) than the results below from our original model. And, the maximum drawdowns would have been much smaller (10% vs 20%)"
MIPS3 and MIPS4 "Blaster" from 2007 - 03/17/2017 (Bacltested)
--------------------------------------------------------------------------------------------------------------------------------
Sent: Sun, 19 Mar 2017 01:24:24 -0500
MIPS Members:
As most of you know, MIPS is basically a Trend Following model, where a market "Trend" is defined as a market that either moves up over time with higher-highs and higher-lows (Up Trend), or moves down over time with lower-highs and lower-lows (Down Trend).
Technical analysts have discovered 27 cycles where identifiable trends occur. Many of these are for "Day Traders" who may trade 6-15 times a day to active traders who may trade 3-5 times a week. These would be identified as very-high-frequency traders.
We will concentrate herein on explaining the three most common (and broad) cycles that most individual analytical investors use; namely Short-Term Cycles (days-weeks), Intermediate-Term Cycles (weeks-months), and Long-Term Cycles (quarters-years). The MIPS models identify each of these trends, and trade mainly on the behavior of intermediate-term cycles (but will yield to short-term or long-term when the trend is extra strong and compelling).
Remember, the MIPS models trade between 6-15 times/year on average. But, no matter how often or how seldom a model trades, good models will almost never go against the trend (as in "Don't Fight the Trend"). So, some years the models could trade 18 times, and other years maybe only 2-4 times.
Also, please be aware that the MIPS models contain algorithms that will force themselves to abandon trend following analysis under certain conditions; such as flat-markets (trendless), compellingly over-bought or over-sold conditions (reversion to the mean), and VERY short-term cycles (to prevent getting whipsawed).
To bring this into our current conditions, please refer to the graph below. The time frame for this graph is between the market bottom in March 2009 and today. Therein, the short-term trend lines are the black ups-and-downs, the intermediate-term trend lines are green and red, and the very long-term term trend line (secular trend) is blue.
From the graph below, you can see with your own eyes that investors that stayed long the entire time from valley to peak (blue trend line) would have done well, as in 3.15 times their money from 75 to 237 in these eight years.
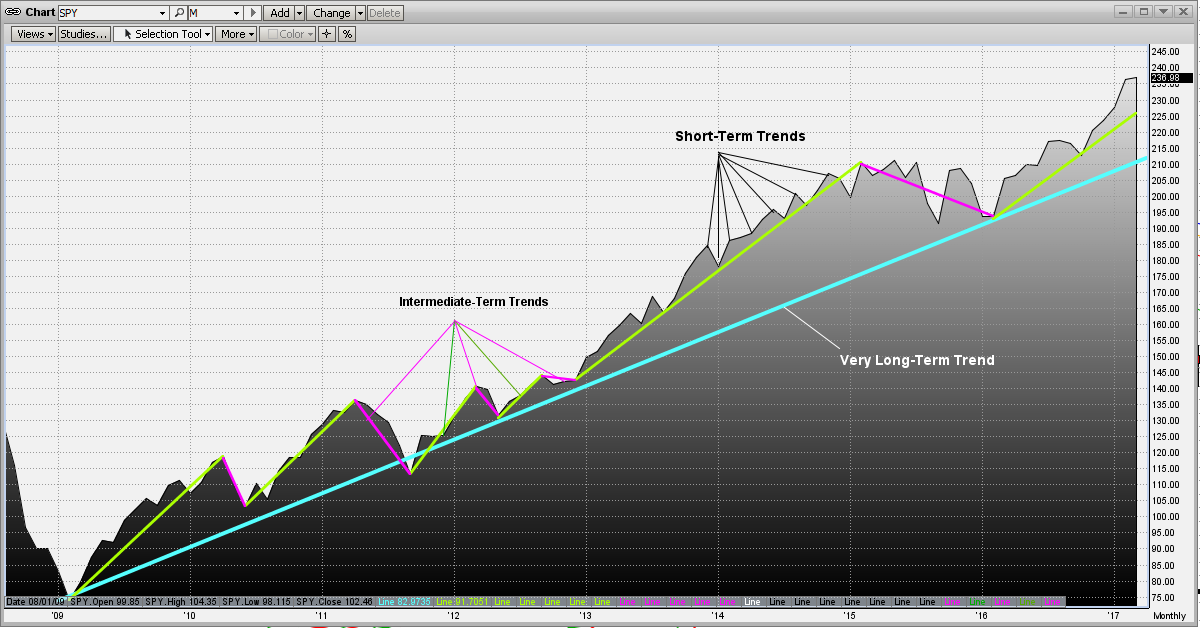
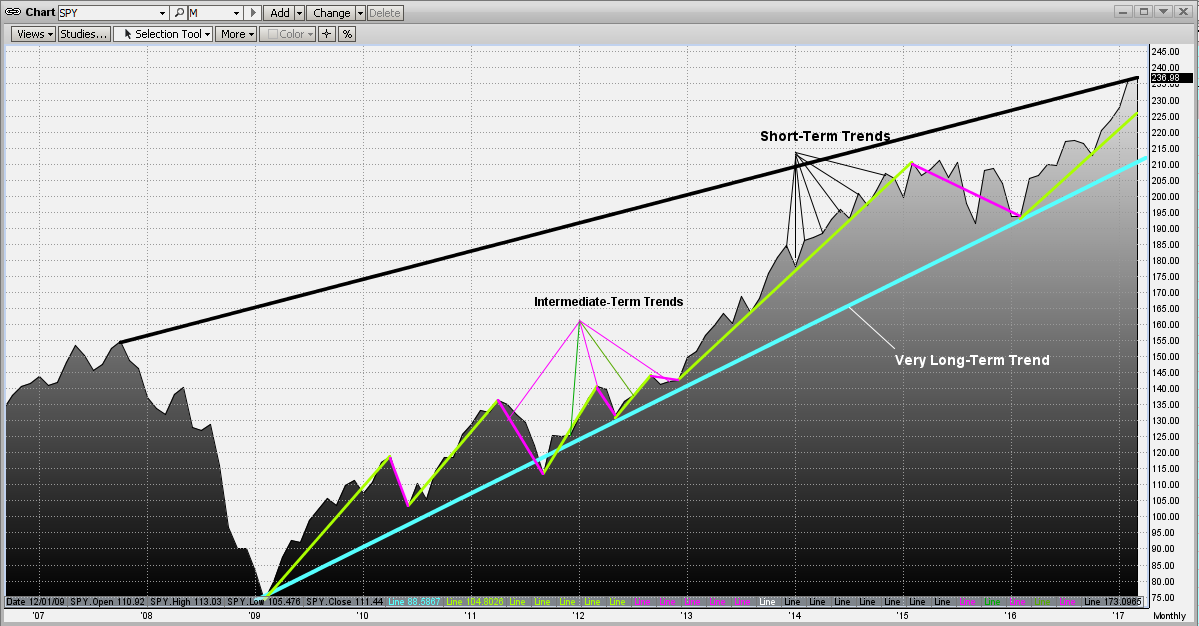
However, it is unlikely that many buy-and-hold investors would have been lucky enough to buy in at the very bottom in March 2008. Most buy-and-hold investors would have been in for a while, so how would they have done from the peak in October 2007 until now (March 2017)? For that, we will see the answer in the black trend line in the graph below. From this, it can be seen that investors would have 1.53 times their money from 155 to 237 (this is only about 1/2 of the growth from valley to peak above).
We will never know what would have happened with the short-term strategy, but we can say if the model was correct a large percent of the time, the returns would have been much higher that that above. But if the accuracy was only mediocre, investors would have gotten whipsawed and risked a large part of their portfolio.
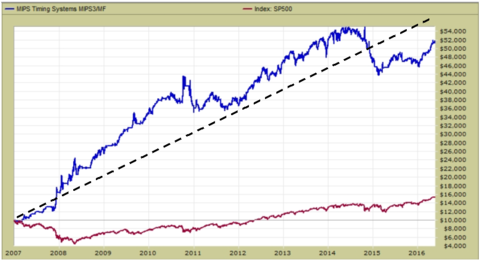
The good news is we can show you verified results of how our "original" intermediate-term model (MIPS3) would have performed in the Oct 2007 to March 2009 time frame. For that, see the graph below from TimerTrac.com (the largest and most respected 3rd party model "tracking" company in the USA).
Investors that followed MIPS3 would have enjoyed gains of 5.20 times their money (much, much better than the 1.53 times their money from buy-and-hold). PS - Even better, these are the results from our original MIPS3 model, because it is the only one of our models that was live all the way back to 2007 (and hence has "verified" results). Backtesting shows that the current MIPS3 and MIPS4 "Blaster Series" models would have produced results more than three times better than the results below from our original model. And, the maximum drawdowns would have been much smaller (14% vs 20%)
We are very proud of our MIPS models and their performances.
Paul Distefano, PhD
CEO / Founder
MIPS Timing Systems, LLC
Houston, TX
281-251-MIPS(6477)


