site map
my account
contact
our facebook page
Latest Posts
Archive

+
...

Market Timing

Tuesday, August 19 2014

8-19-2014

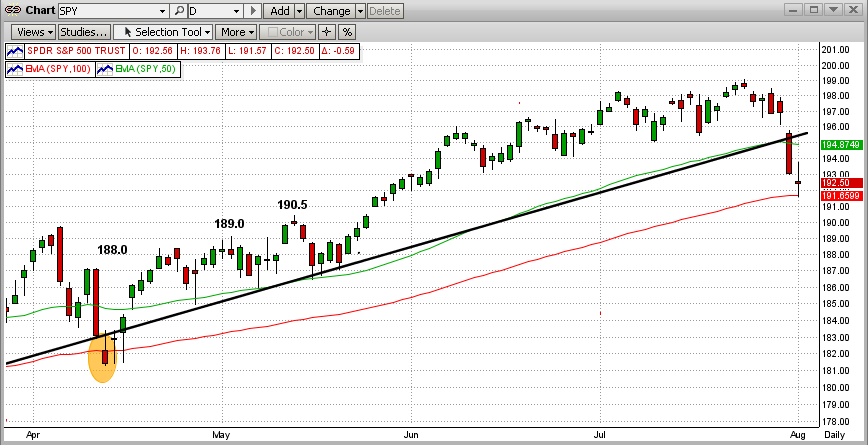
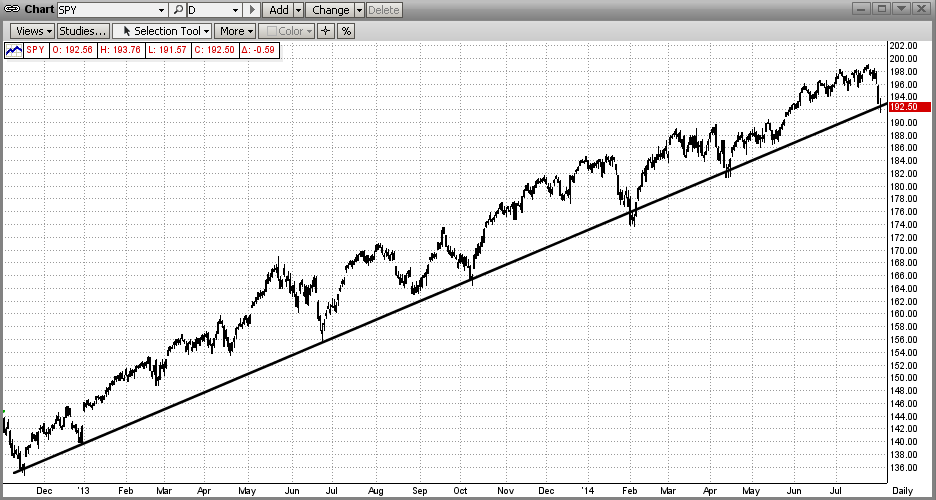
This blog is all about the latest short-term trend in the market, which started  on 5/22/2014 with a breakout of the SPY after a  2-1/2 month sideways/flat market (remember "No Man's Land" in the purple box below).  Of course, this is the tail end (so far) of a strong intermediate-term uptrend that started almost 2 years ago in Nov 2012 (black line).  See the graph below.

Legend:
Green Curved Line = 50-Day EMA
Red Curved Line = 100-Day EMA
Black Line = Intermediate-Term Trend Line
Green Lines - Short-Term Trend Lines
Purple Box = Sideways/Flat Trading Pattern
Orange Circles = Significant Points

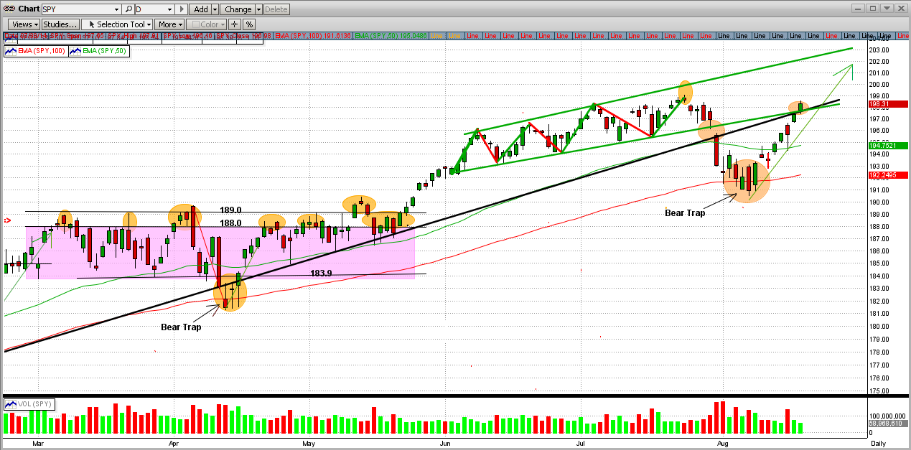
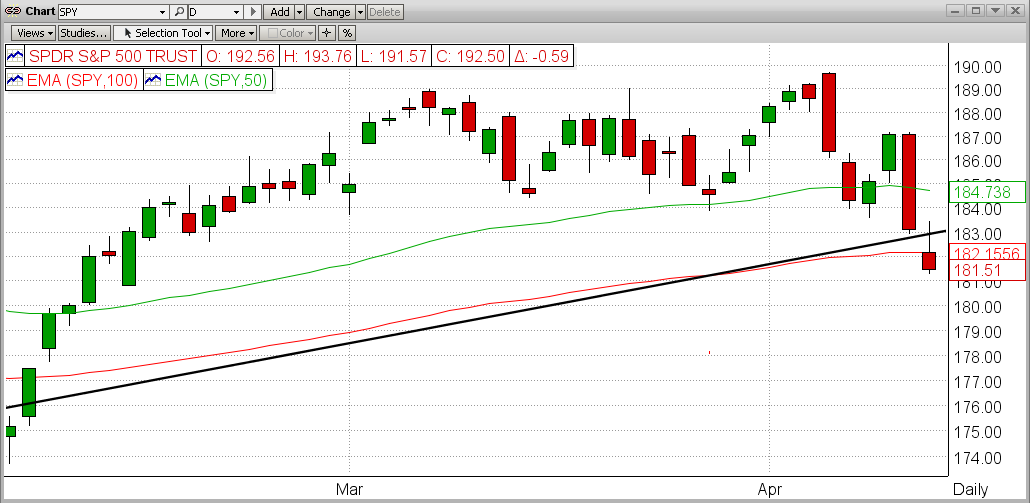
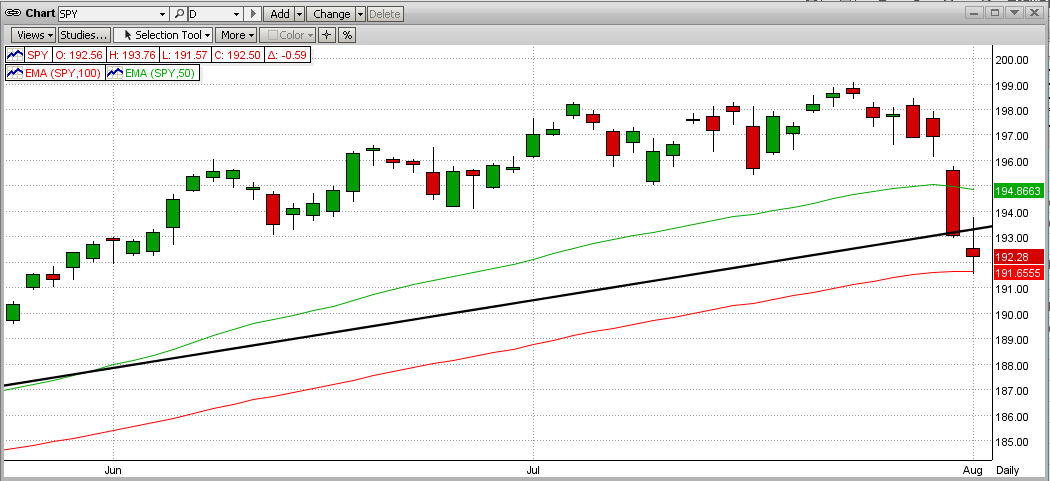
We are most interested in the pattern that started developing at the beginning of June 2014. This has evolved into what is called an "up channel".  Swing trades will trade this as follows: Buy when the SPY hits the bottom channel line and Sell when it hits the upper channel line. Some very experienced swing traders can make money at this, but most amateurs get crushed (surprise, surprise).  Most of the time, trading these patterns leads to getting whipsawed badly. For most investors, it is best to ride the uptrend by staying long (or short in downtrends).

The market (the SPY) traded in this range almost to perfection until the 3rd week in July when it failed to "hit" the upper trendline, and then it fell 4.3% over the next 2 weeks (from about 199-190). Also, during that fall, the SPY broke both its 50-Day EMA and 100-Day EMA.  Of course, this caused many traders to go short, only to get whipsawed with a quick reversal a couple of days later.  MIPS dodged this "Bear Trap" and stayed long.  At the close today, MIPS was under its all-time high price by only 1/3 of 1% !!!. 

For the uptrend to be re-established, the SPY will need to climb above its all-time high of $199.1 (on 7/21/2014).  If it does we, along with 200 million other investors in the US stock markets from all over the world, will make more money on this uptrend (even better if you have a percent of your money in double leverage, like the SSO).  Better yet, if the market does tank, we (along with a relatively few individual investors that "short" like the hedge fund managers do) will make lots of money.  So, don't be afraid of the "Big One".  Hope for and embrace it !!!


Sleep Well !!!

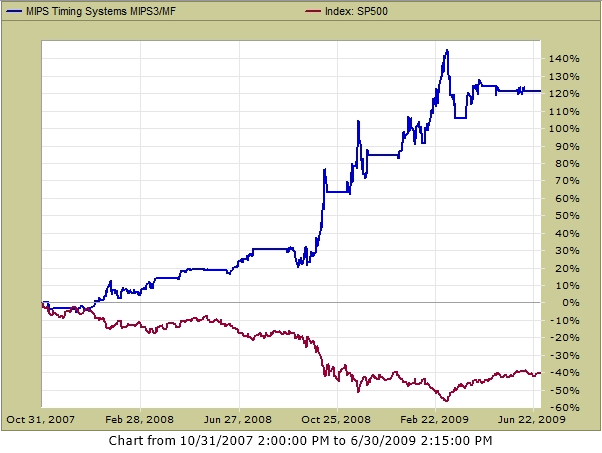
Remember what MIPS did in 2008?
 

- If not, see below
Red=Shorts, Green=Longs, Yellow=Cash


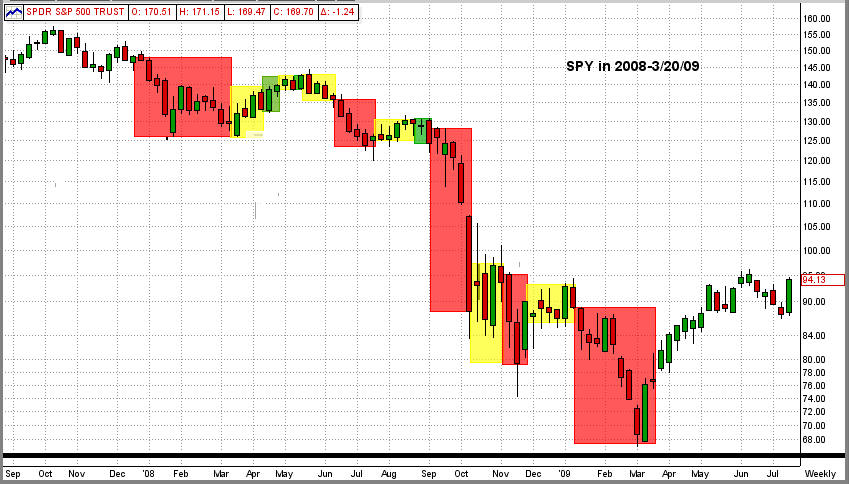
MIPS in 2008 (from TImerTrac.com) 
- look forward to repeating something similar to that below

Posted by: Dr. G. Paul Distefano AT 10:43 pm   |  Permalink   |  Email
Sunday, August 03 2014

August 3, 2014

At the end of last week, we had a large number of members asking "Is this the beginning-of-the-end of our 5+ year bull market"?  Of course, this was prompted by last week's terrible market performance.

Before we go too deep, let's take a look at some recent market action of the SPY (ETF for the S&P 500).  (Remember, the SPY's price is about 1/10th of that of the S&P 500.)

Look at the 1st Graph below (SPY). 
In this recent time period, the last 6 trading days were bad. But how bad is bad and where does it take us?
- The SPY dropped almost 4.5% in the last 6 trading days in the graph below.
- On the last day in the graph below, the SPY broke down through the 100-day EMA and the long-term trendline.
- On the day before that, the SPY had one of its worst one-day drops in over a year (-2% in one day).
1) Does the price action of the SPY (steep drops) upset you?
2) Are you having trouble sleeping because of it?
3) Do you think that this the beginning of a real Bear Market?
4) How far do you think the SPY will drop from here?
5) Are you ready to "override" the MIPS long signal and go to cash or short?

1st Graph

Usually when we look at price action graphs, I try to explain what I think happened and what might happen from here on.  Well, this time I know 100% what happens next.  Yes 100%, and guaranteed.  And no, I have not lost my mind nor do I think that I have somehow acquired divine status.

This reason that I can make this iron-clad guarantee is that the graph above (that looks so much last week's price action) is actually from 4/11/14 (3-1/2 months ago).  From that exact day, the SPY reversed itself and continued up (+8.5%) until 7/30/14.  See Graph #2 below.

Graph #2

Now how do you feel about the price action in Graph #1 from 4/11/14?  Now that you have seen a nice recovery and more up-side gains, your fear and confusion most likely just sank into a sinkhole.  So, are we through with those kinds of scares.  Heck no, and the market is no place for the weak of heart or mind (unless, of course, you have MIPS covering your back).

Let's truly visit what we thought we were looking at in the very beginning of this blog - the price action of the SPY last week (see Graph #3 below). Do you see the resemblance of this graph that goes through 8/01/14 to that in Graph #1 that goes through 4/11/14?   The markets do repeat themselves.

Graph #3

 
Now we can go back to our old way of playing the game.  Where do we go from here?  We believe that there is just as good a chance of the market turning around and heading back up (as it did 8-10 times in the last 20 months - Graph #4 below) as of it heading down into a large correction or a real bear market.  Each of these scenarios have credibility and each is possible.

But, that is just what we think. MIPS is looking at this from a completely different angle.  I can say that some of the MIPS models are on the brink of going short, but one or two up-days can change that.  Let's keep a close eye on changes in the MSI and watch for MIPS signals.

Graph #4


Hope this helps !!!

Posted by: Dr. G. Paul Distefano AT 01:09 am   |  Permalink   |  Email

MIPS Timing Systems
P.O. Box 925214
Houston, TX  77292

An affordable and efficient stock market timing tool. Contact MIPS
281-251-MIPS (6477)
E-mail: support@mipstiming.com