FYI - Stocks have not been rallying for the last 10-16 months in the USA alone.
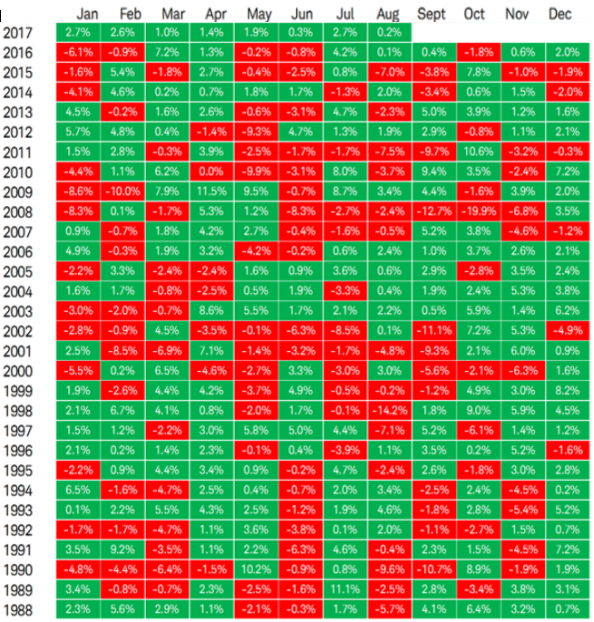
The current trend in the S&P 500 has been up for a relatively long time. But it is not alone. The MSCI All-Cap World Index (ACWI) has been up EVERY MONTH for the last ten months (and for 13 of the last 14 months). This is the first time in its 30-year history that a rally in this Index has been this perfect for so long. See the Table immediately below.
We all know that the current trend in the SPY has been strong since 3Q'16, and continues to be at this time. When a potential war with N. Korea, multiple record-breaking destructive hurricanes, a severely divided country and Congress, etc., is not enough to "turn a trend", then almost by definition, that trend must be strong.
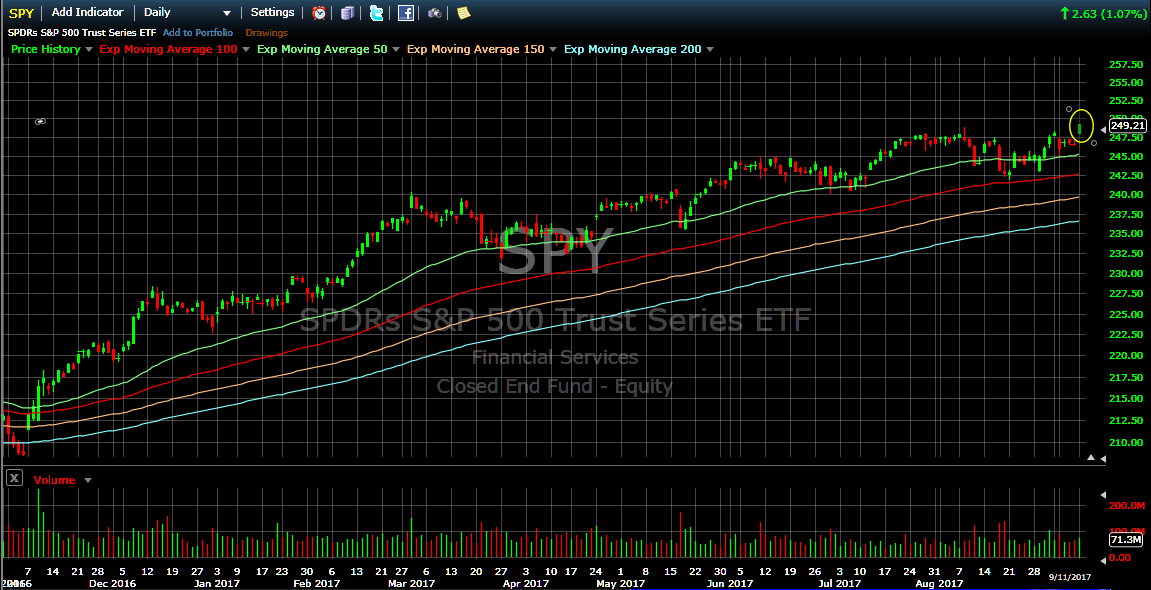
Here is what today's trend looks like from a technical perspective.

Note: Almost perfect, low volatility "Up -Trending" EMAs (50-100-150-200-Day EMAs)
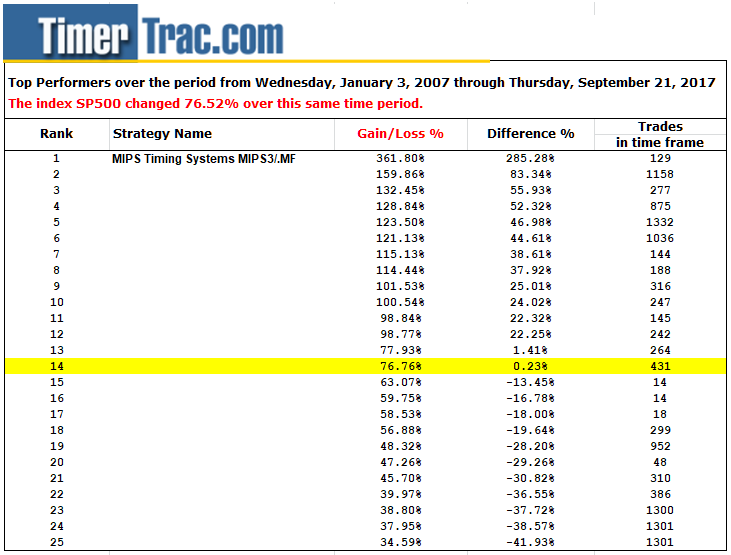
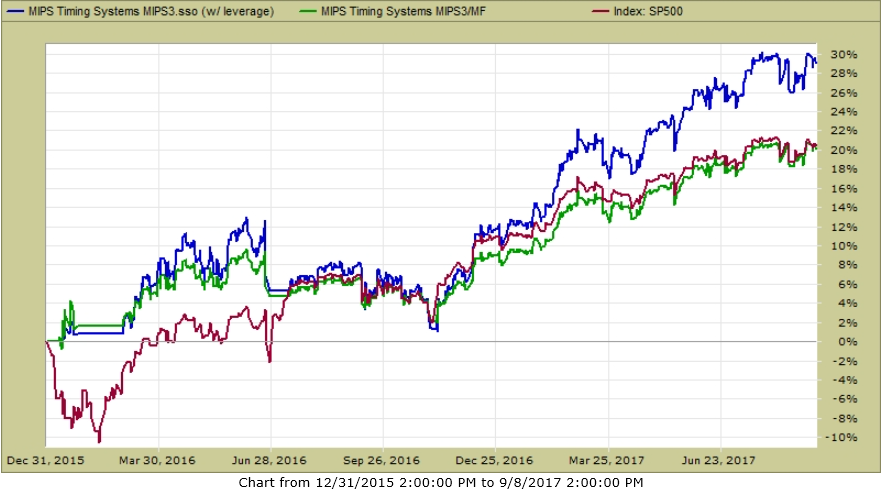
So, how has MIPS performed in the time period?
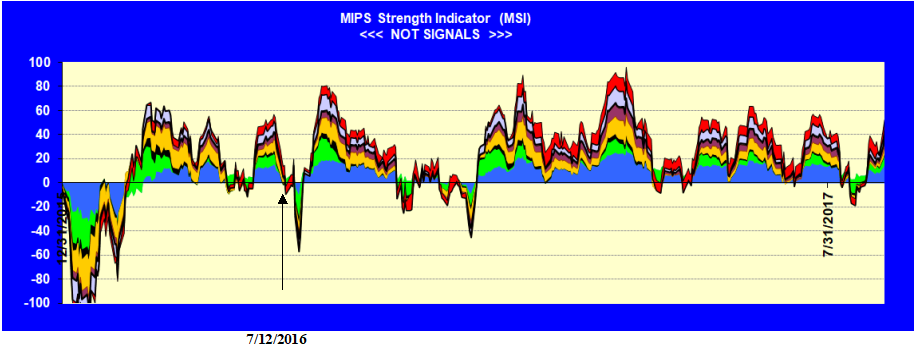
MIPS is doing a great job of not getting "sucked in" to the little dips over the last 18 months and has produced excellent results.
2016 - 170908
Blue Line - MIPS3 1.5x Long / 0.5x Short +29.5%
Green Line - MIPS3 1.0 Long / 1.0x Short +20.5%
Red Line - SPY + 2.5%
(From Timer-Trac.com)
Paul Distefano, PhD
MIPS Timing Systems, LLC
Houston, TX
281-251-MIPS(6477)