Saturday, August 04 2012
As suggested in our previous post, the market appears to be in a slow growing up-trend.
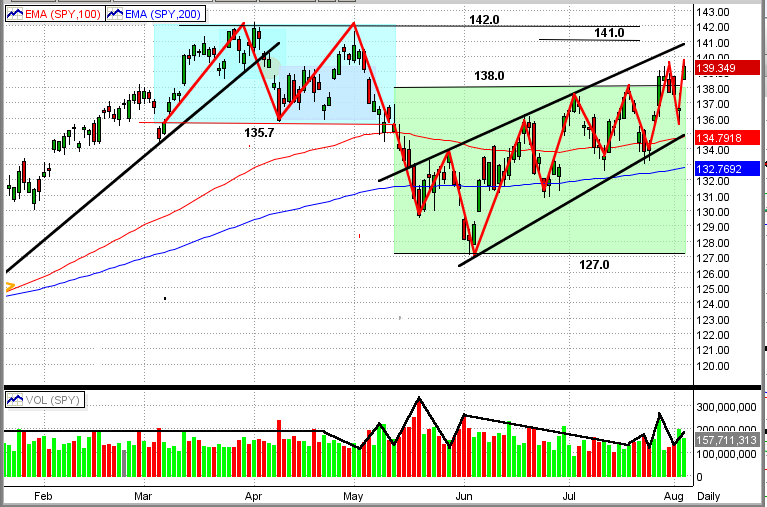
See the new graph immediately below. From this, you can see that:
1) The SPY has broken out of its prior trading range (green rectangle) to the up-side
2) The up-channel is readily apparent (black lines)
3) Since mid-year, the market is moving with precision to higher-highs and higher-lows
4) The SPY is above both of its 100-day and 200-day EMAs
5) In the last two swings, the SPY volume has been increasing in up markets and dropping in down markets
Let's enjoy this up-trend while it lasts. We expect a high level of upside resistance for the SPY between $141-142/share.
- if the SPY breaks this resistance to the upside, its next big resistance levels are between about $145-150/share
- at this time, we are about 13% below the 2000 and 2007 highs (approx. $157/share)
- this would be a good goal to attain, but it would also make an ideal point for the big guys to start selling big time.
If, or when, the market turns down (as it probably should), MIPS will get us to a cash or short position in ample time.
|


