Whereas MIPS members who have been with us for years have seen this before, lots of "newer" MIPS members are wondering if the most recent MIPS signal (7/11/2016) is our longest ever, or maybe even if the MIPS models ever trade. Of course, they know better, but it can feel that way when a MIPS signal has a long "signal life" (like this 9-month, approximate 180 trading-day signal). {To set the record straight, the current signal is NOT the MIPS signal with the longest signal life . In the past, some have lasted well over a year. And, the MIPS3, MIPS4, and Nitro models trade an average of 12-15 times/year.}
Our previous Blog below explains why and how the MIPS signals can last for a long time (long signal life), and what causes them to change position ("trigger"). The Blog below was meant to be a general explanation, but in this blog, we would like to concentrate on the "current "signal.
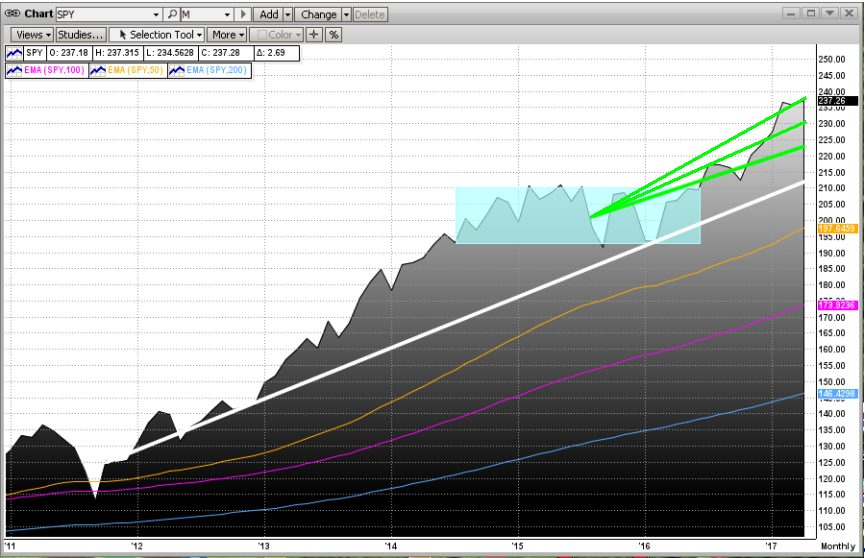
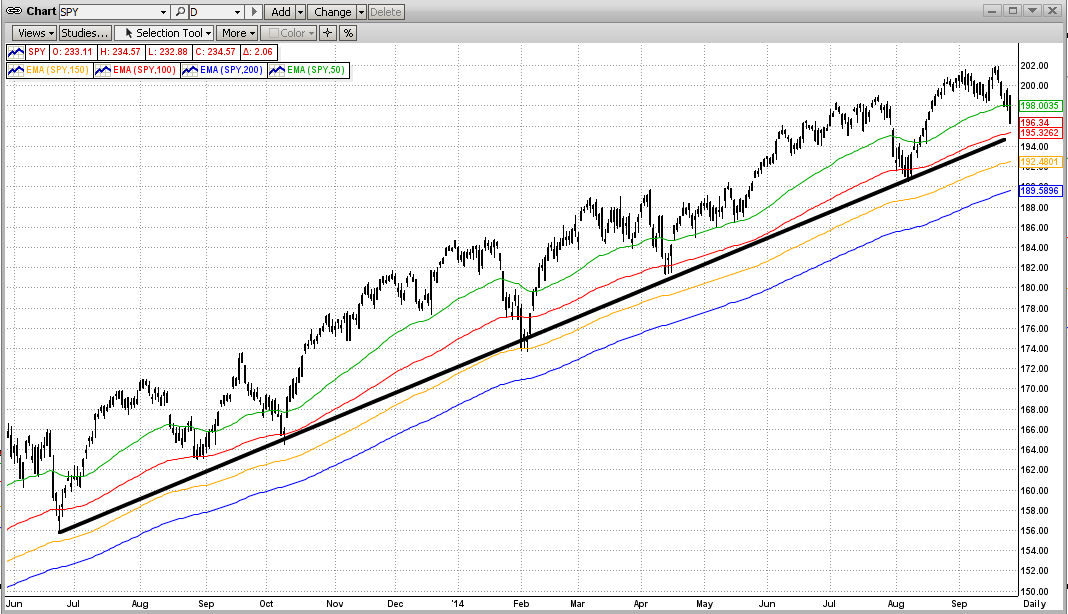
To start, let's analyze the graph below.
- the white trend line shows the strength of the long-term trend (since 2012)
- the orange, pink, and blue lines show the 50-day, 100-day, and the 200-day EMA's
- the green trendlines ("fans") show the strength of the trend since our last signal (7/11/2016)
The trends of the current signal (green "fans") are as strong or stronger than the long-term trend, and the EMAs are going up nicely and are well spread-out as they should be in a typical, strong up-market. BTW, these EMAs will "bunch up" (i.e., get real close to each other) when the market finally "rolls over".
No wonder MIPS is staying Long and not going Short (or to Cash). But, not all models are like MIPS. Many short-term models tried to trade the ups-and-downs in the flat trading range below (blue box), and got whipsawed.
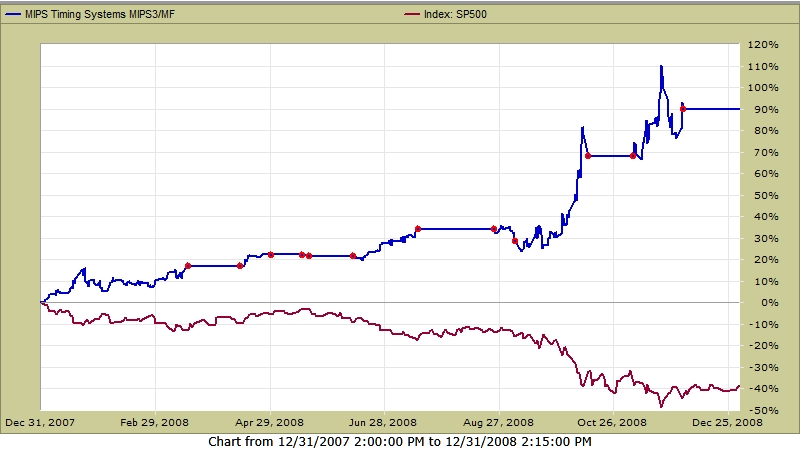
Actual Trades in 2008 and 2009
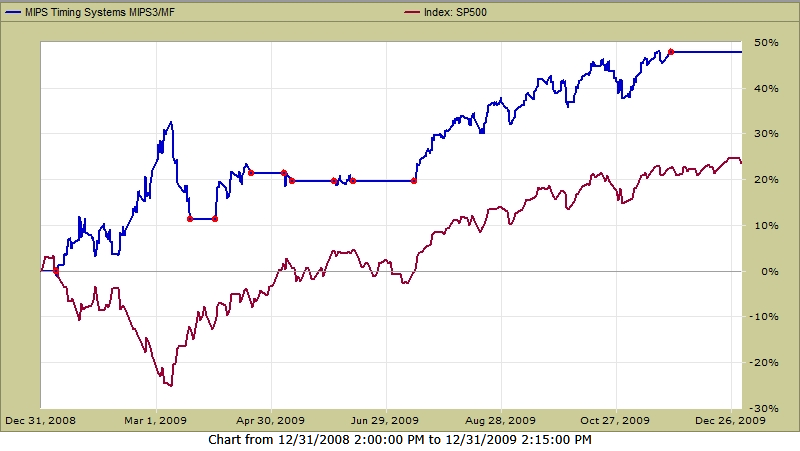
Just to support our claim that the MIPS models "trade when they should" and don't just "trade to trade", look at the actual, verified trades that the MIPS3 model issued in 2008 and 2009. Of course, this led to great gains (70% and 45%), in these two years respectively. PS - the red dots are actual trade dates.
Actual Trades in 2008 (from TimerTrac.com)
Actual Trades in 2009 (from TimerTrac.com)
And, look at the MIPS3 Performance in 2016-2017 ytd (from TimerTrac.com)
Green - MIPS3 trading SPY 1.0x Long / 1.0x Short
Blue - MIPS3 trading SPY 1.5x Long / 0.5x Short
Red - SPY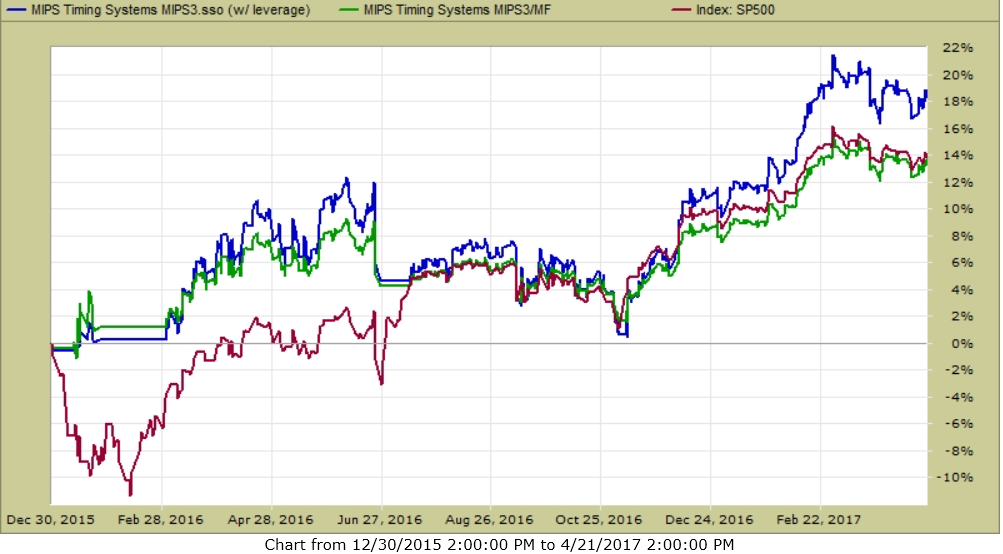
Please feel free to email or call us with questions...
Thanks,
Paul Distefano, PhD
MIPS Timing Systems, LLC
Houston, TX
281-251-MIPS(6477)
support@mipstiming.com
<<< Previous Blog >>>
April 19, 2017
Subj: MIPS - What Makes MIPS "Trigger" a Signal Change?
MIPS Members:
At almost any time, lots of MIPS members ask questions like:
1) Is MIPS getting ready to issue a new signal?
2) What makes MIPS issue a new signal?
3) How much does the market have to drop before a MIPS model issues a "Short Signal" ?
etc, etc, etc.
To understand the answer, one has to understand the concepts of some of the underlying algorithms in the MIPS models. Most "timing models" on the market today are what we would call "Linear Models", which means they basically do the same thing every time a "similar" event happens (like the SPY crossing its 200-day EMA), without regard to different external circumstances.
The MIPS models are much more "self-learning and self-predicting", which means that the MIPS models not only want to know where an indicator stands (like the SPY being above or below its 200-day EMA), but how it got there and where might it go from where it is now. A simple example of this is, if the SPY is 1% below its 200-day EMA, most models would rate this as "negative". But, the way that MIPS would look at this is, if the SPY is 1% below its 200-day EMA and it got there by falling from 6-8% above the 200-day EMA in the last 30 days or so, MIPS would look at this as negative. On the other hand, if the SPY is 1% below its 200-day EMA, BUT it got there by climbing up from 6-8% below the 200-day EMA in the last 30 days, MIPS would look at this as positive (because the "slope" or direction of the SPY is pointing up strongly).
Another, a more pertinent example of MIPS being "adaptive" and not simply doing the same thing every time a "similar" event happens, is that sometimes it takes a 5-6% move in the SPY for MIPS to trigger a new signal (like from Long to Short); but at other times, MIPS could "trigger" a new signal with a move of just 2-3%. This decision is made inside the MIPS models, and it depends upon the "relativity" of the most recent, short-term "move" in the SPY compared to the longer-term behavior of the market.
Examples
Graph #1
The MIPS models would most likely NOT go short on 4-6% drops in the SPY if the market has moved up 12-25% on a strong trend of intermediate-term cycles in the previous several months (kind of like now).
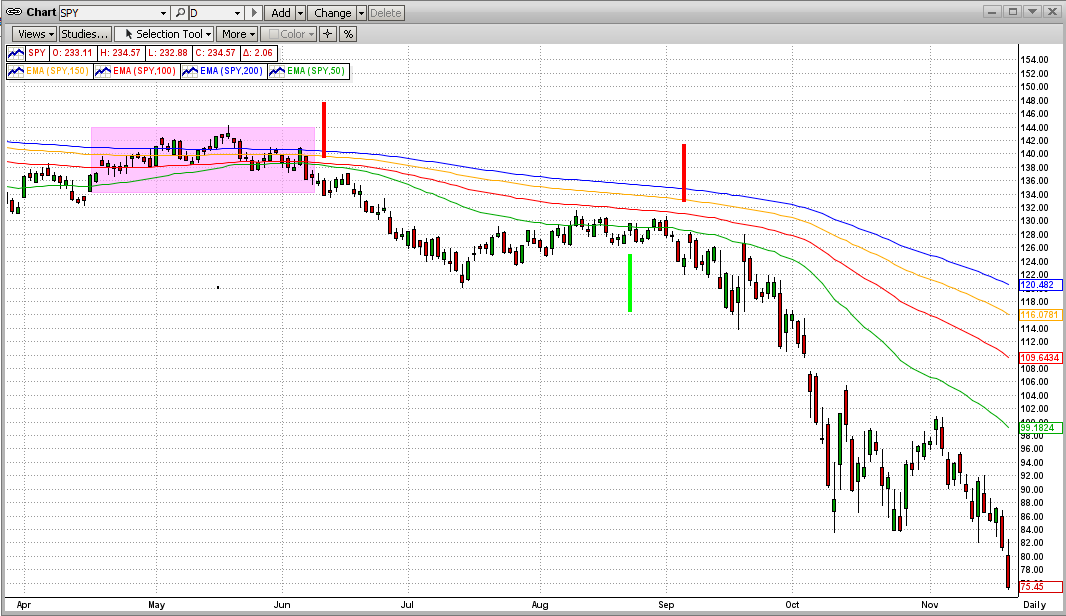
Graph #2
The MIPS models could go short on just a 2-3% drop in the SPY if the market trading range in the previous 3-4 months has been relatively flat; because a 2-3% drop is "significant" relative to the up/down volatility in a flat market. This is a very positive trait of the MIPS models because long-term market trends do not simply change direction instantly, but rather they "waffle" at the top or bottom for a several months (up to 12-15 months) before completely changing direction (called "Topping"). Note - the red and green vertical lines in the graph below show "actual" short and long signals from the MIPS3 model near the beginning of the 2008 Market Crash.
Also, please remember that the MIPS models are designed with higher-level math, pattern recognition, artificial intelligence and well over 100 standard market indicators. And, each of these have a certain "weight" in the final vote (long/short/cash). Through our "self-learning" algorithms, the "weight" of each of the above change over time, depending how accurate their "votes" were in the past. This works great for improving the performance of the MIPS models, but it makes it almost impossible for any "human" to predict the actual time or final cause of a MIPS signal change.
On average, the MIPS3 and MIPS4 models issue an average of 12-14 signals per year. The actual number of signal changes in any given year depends upon the number of times that the intermediate-term cycles change direction (as determined by the models). The MIPS models have traded 18-20 times in some years and only 3-4 times in other years. Some trends tend to go on forever (like now). Our current "Long" MIPS signal has been in effect for over 9 months now (a new record). Our main goal, of course, is making money, not just trading to be trading. Mission accomplished !!!
Please feel free to email or call us with questions...
Thanks,
Paul Distefano, PhD
MIPS Timing Systems, LLC
Houston, TX
281-251-MIPS(6477)
support@mipstiming.com


