We have recently received several questions regarding the trading frequency of the MIPS models. Of course, the motivation for this is that the MIPS3/MF model has only traded twice in the last 12 months (and MIPS4/MF+ model has only traded 4 times in the same time period).
Over the last 11 years, these two MIPS models have traded an average of 10-15 times/year. But, what does that mean? It certainly does not mean that they trade once a month. A model that trades an average of 12 times/year can trade 2-4 times in some years and 18-20 times in others. And, when it does trade 12 times in one year, it can trade 3 times in one month and only once in the next 4-6 months.
The number one criteria that dictates the number of trades in any time period for a "trend following" model (like MIPS) is, of course, the time duration of the intermediate-term trends in said time period.
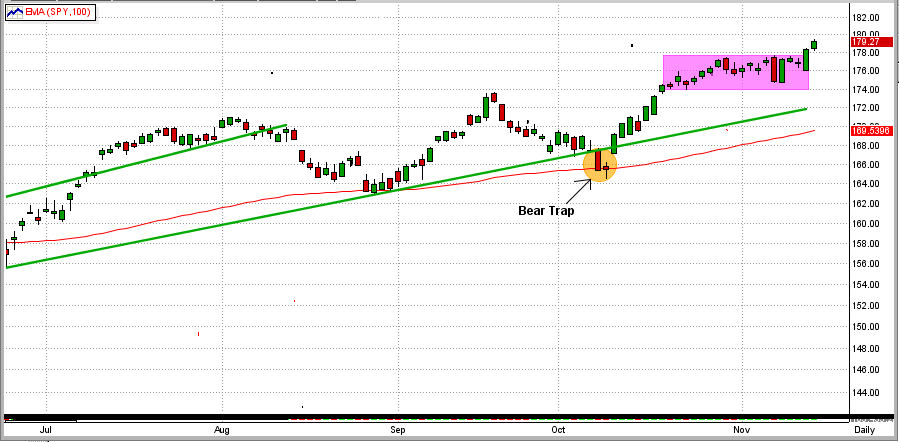
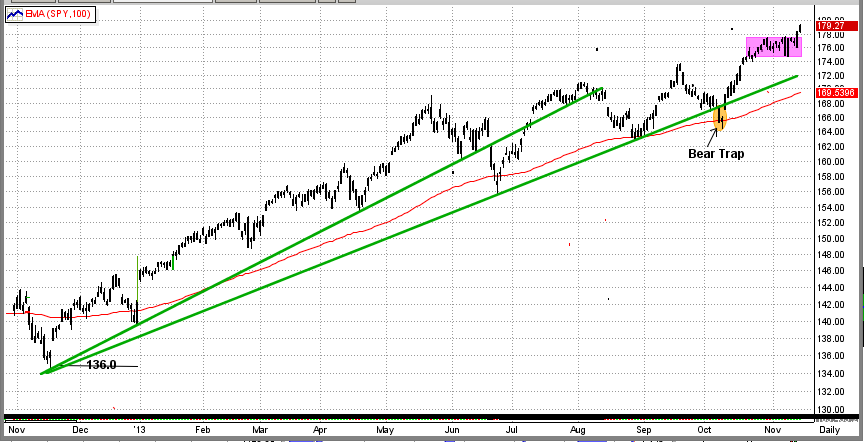
So, how does the above apply to MIPS3 and MIPS4 for 2013? To answer this question, let's look at the graph below of the SPY price action in the time frame of Nov'12 through Nov'13. In this graph, one can see the nearly perfect 12-month trendline of the SPY, and can hence understand why the MIPS3 and MIPS4 models have been long for the vast majority of this time period with very few trades. Remember, the MIPS models are following intermediate-term trends. A faster acting model would have tried to ride the shorter-term waves in the graph below, and would have traded much more often with no guarantee of better returns (but with a good chance of getting whipsawed).
SPY
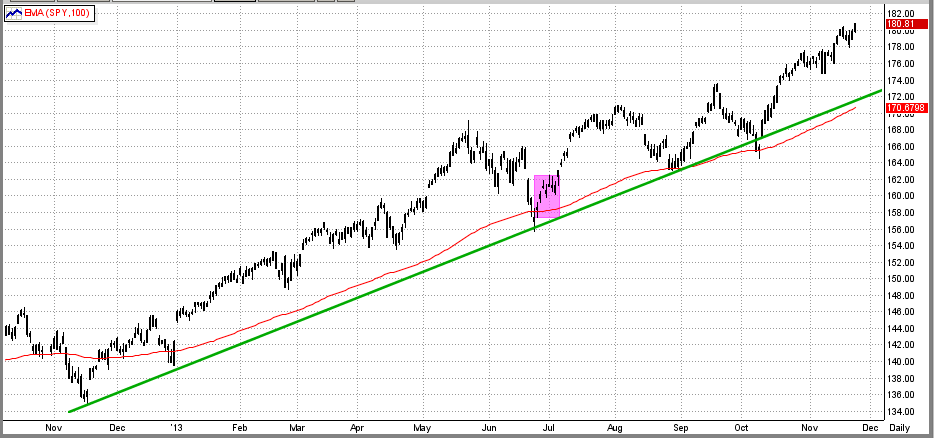
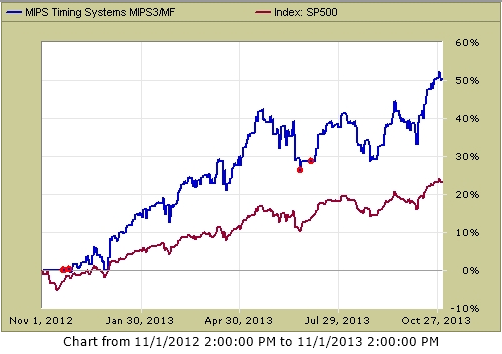
LAST 12 MONTH'S PERFORMANCE (all graphs from TimerTrac.com)
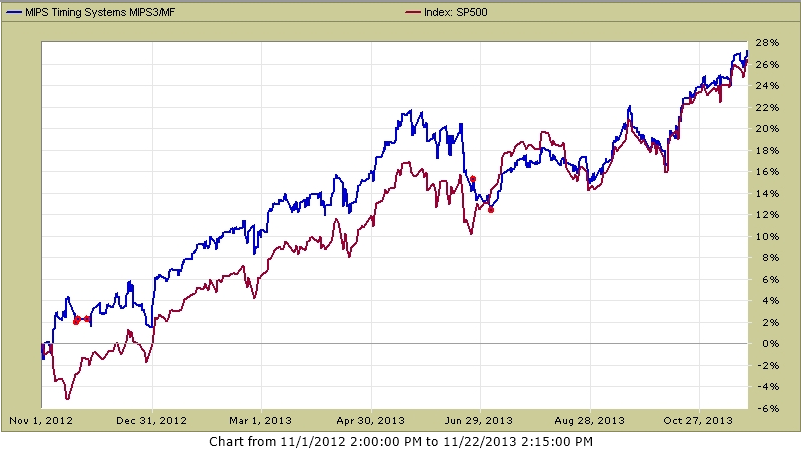
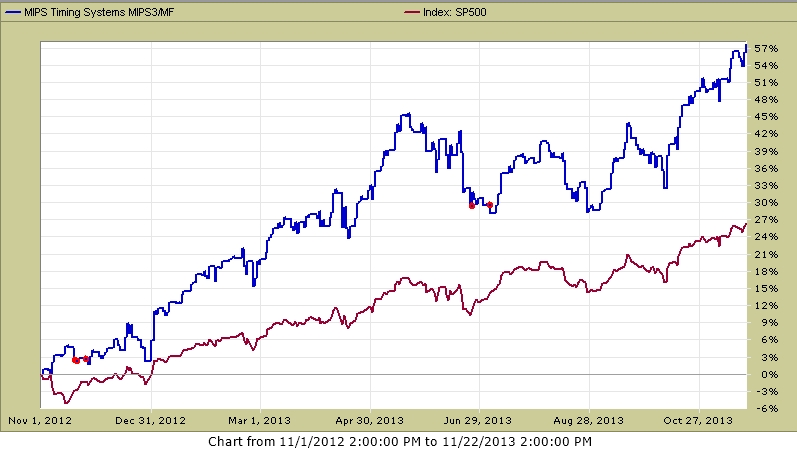
So, how did the MIPS3/MF model do in the last 12 months. We report most of our performance reports with MIPS trading the SPY long/short (or SPY long and SH short). But many of our MIPS members (including myself) trade "combos" like 1/4 each of SPY, IWM, QQQ, and SSO. See the performance of these ETFs below.
MIPS3 Trading SPY long/short
MIPS3 Trading IWM long/short
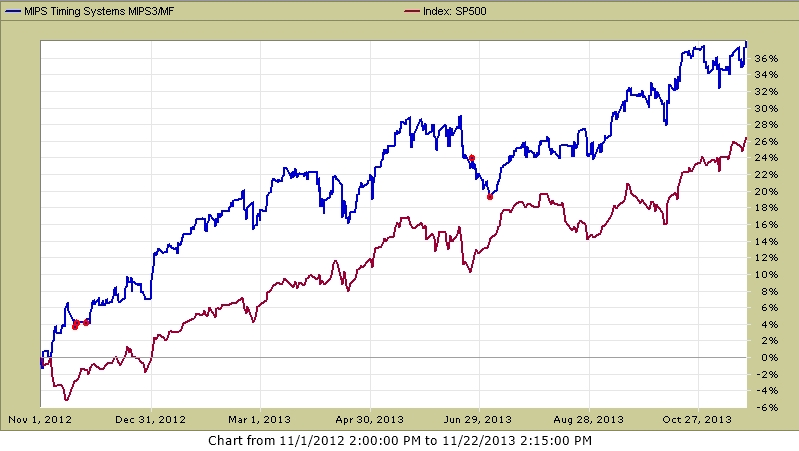
MIPS3 Trading QQQ long/short
MIPS3 Trading SSO long and SH short
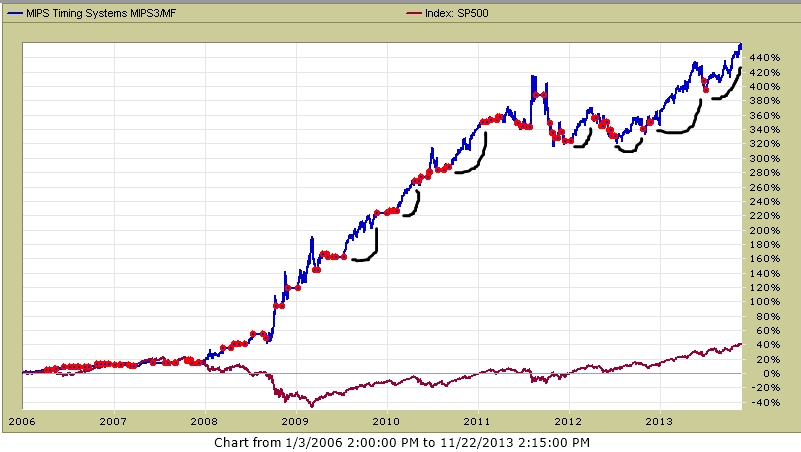
PAST BEHAVIOR
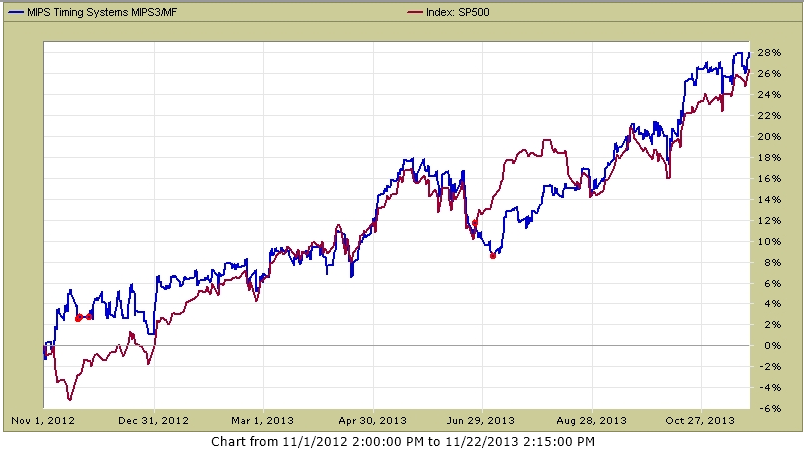
Please understand that a signal with a "life" of several months (not days) is normal behavior for the MIPS models. The models will follow the intermediate-term trends (up or down) for as long as these trends continue in the same direction. The red dots in the graph below show trades for the MIPS3 model during the time period of 2003-11/20/13. It can be seen that, in this time frame, there were at least 7 times in these 11 years when a trade signal lasted 4-6 months. And, you can see that ALL of them were winning trades (long and short).
MIPS3 Trading SPY long/short