The stock market is arguably at the most critical point in its six-year uptrend that started in 2009. The SPY is very near its "all-time high" that it has failed to grow above in the last 10 weeks (and in fact dropped way below). And, "all-time highs" are a tough resistance level to break at any time. Let's see why.
Resistance Levels
Resistance levels are "deemed" price levels that up-trending markets are going to have trouble breaking above. So, why are new-highs "deemed" resistance levels and why are they hard to break above? Simply because lots of traders bought at those levels or at least are waiting for the market to reach those levels so they can sell. Problem is, they did not sell at the all-time high levels the last time and are (and have been) waiting for the market to get back to its all-time high. When the market is below its all-time high, most traders and investors are sorry (or sick) that they did not dump at the all-time high level. So, many are impatiently waiting and determined to sell if or when the market gets back to its all-time high level (lots of pent-up supply there).
SPY Chart
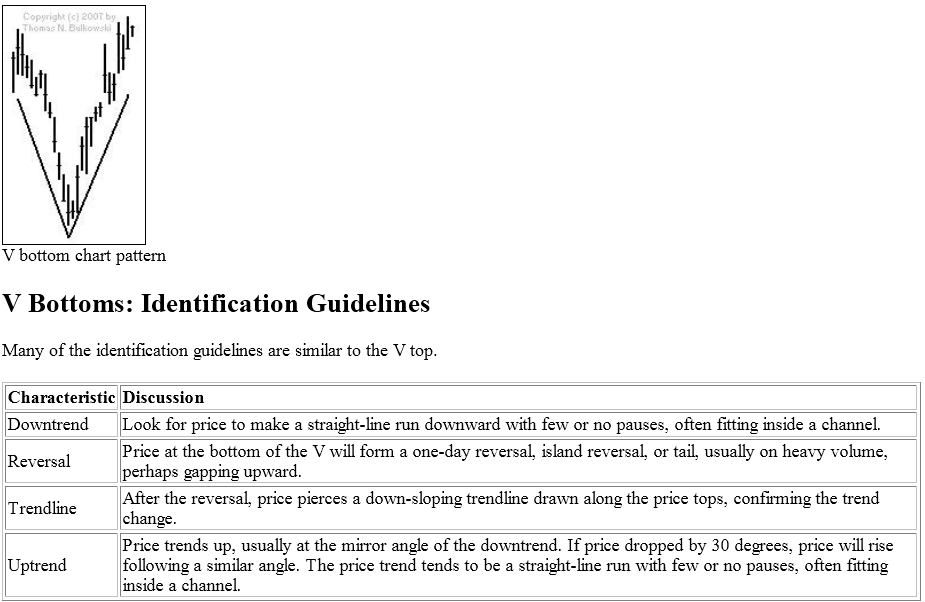
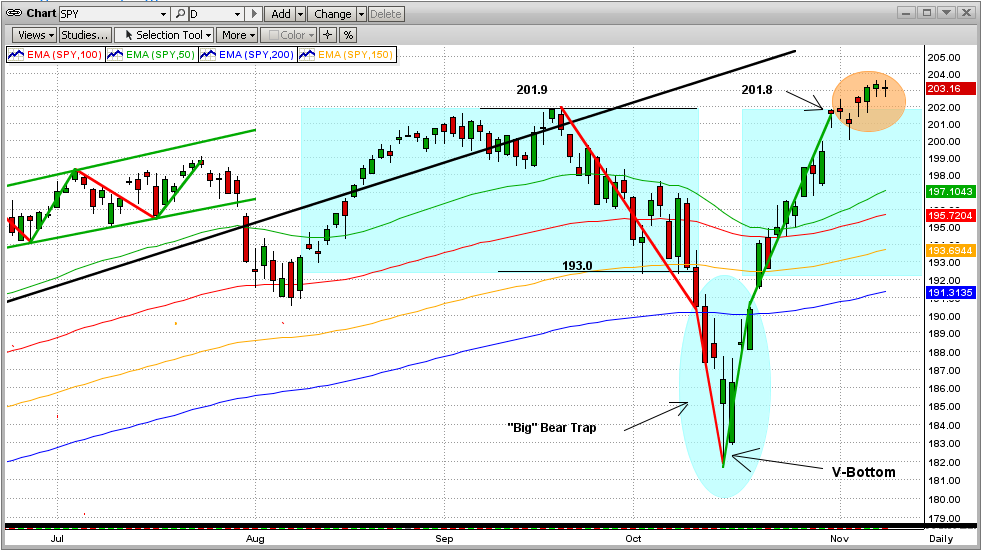
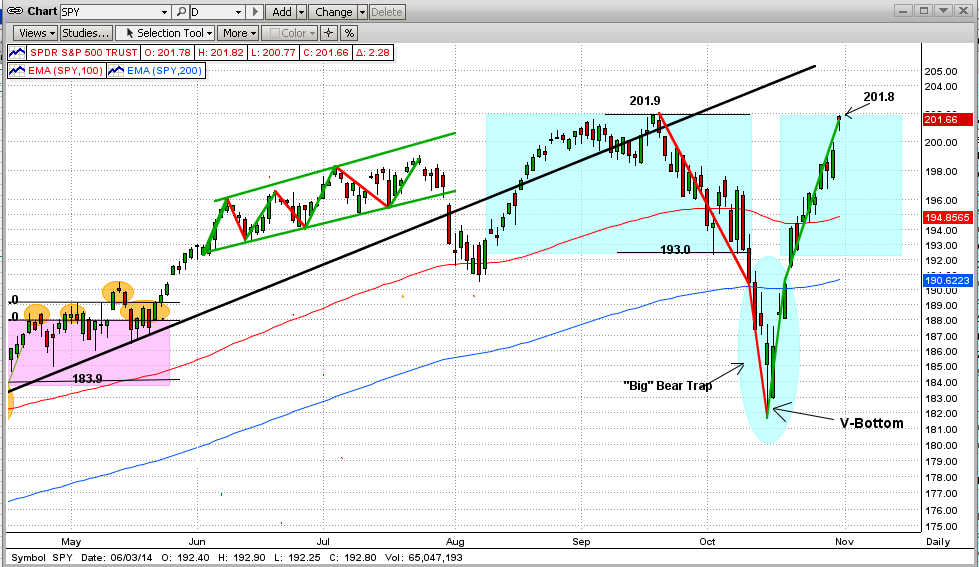
The SPY price chart is telling us multiple things (see graph immediately below). First, the SPY formed a dramatic V-Bottom. You can see the V-Bottom pattern in the graph immediately below (see a detailed explanation of a V-Bottom pattern from Bulkowski in the 2nd graph below). The V-Bottom is extremely important here because: (1) it formed a near-perfect, symmetrical up-and-down trend, (2) the downtrend was stopped by a perfect one-day key reversal, and (3) the top of the uptrend is less than 1/20th of 1% from the SPY's all-time high. Wow! V-Bottoms like this usually are identifying a market bottom (but it CAN be just a short-term bottom).
Critical Point
We are at a critical point in this market, and only time will tell which way we go from here.
If the SPY fails to break above its all-time high of 201.9 in the next few days, it will most likely keep trying for the next few weeks, Remember, to call it a "break above", the SPY needs to break significantly above 201.9 and stay there for a while. If this does happen, the market could then go into "panic buying" because everyone that is not in the market is sick and determined to "join the party". Remember, the four stages of market development after a big turnaround like 2008 into a new bull market are: (1) Pessimism, (2) Skepticism, (3) Optimism, and (4) Euphoria.
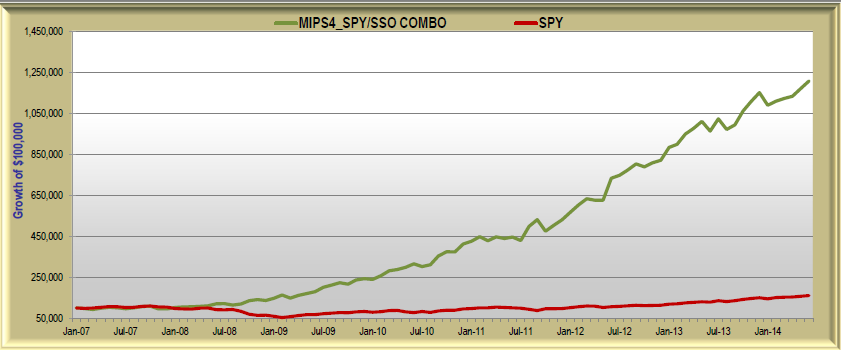
On the other hand, if the SPY tries several times and fails to break above 201.9, we could then see the big crash that we have all been anticipating. This could be ugly, but we believe that MIPS will make us money in the market fall as it alway has in the past. Stay Tuned.
V-Bottoms
http://thepatternsite.com/patternz.html