MIPS Members / Followers:
- please take 2 minutes and complete the SURVEY at the end of this email...
I am sure that all of you have heard the expression "Sometimes we can't see the forest for the trees". Of course, this implies that in a thick forest one can only see 20-30 feet in any direction, and hence they have no idea what there is beyond that. So, if a stranger was in the middle of a forest in a horrific fire, they would most likely think that this fire could consume many homes and even some small towns. Hence, they would probably do everything that they could to alert the authorities in the area.
However, if the person was in a "forest" that was only 50 yards wide in each direction, surrounded by 100's of acres of just grass/weeds, then this forest fire would not be a threat to anyone except the stranger in the fire. Of course, another person in a small plane could immediately see the small size of the "forest" and completely understand that the fire was really no big deal.
Along this line, many people get bogged down in the very latest movements in the market without understanding how the market got where it is and what the underlying factors/movements mean. With this only info, they have almost no significant data to help them understand where the market is going from here and when.
Like many other things in life (like the guy in the small plane above), sometimes we have to back away and take a look at what we are analyzing from a longer-term view.
In the two graphs below:
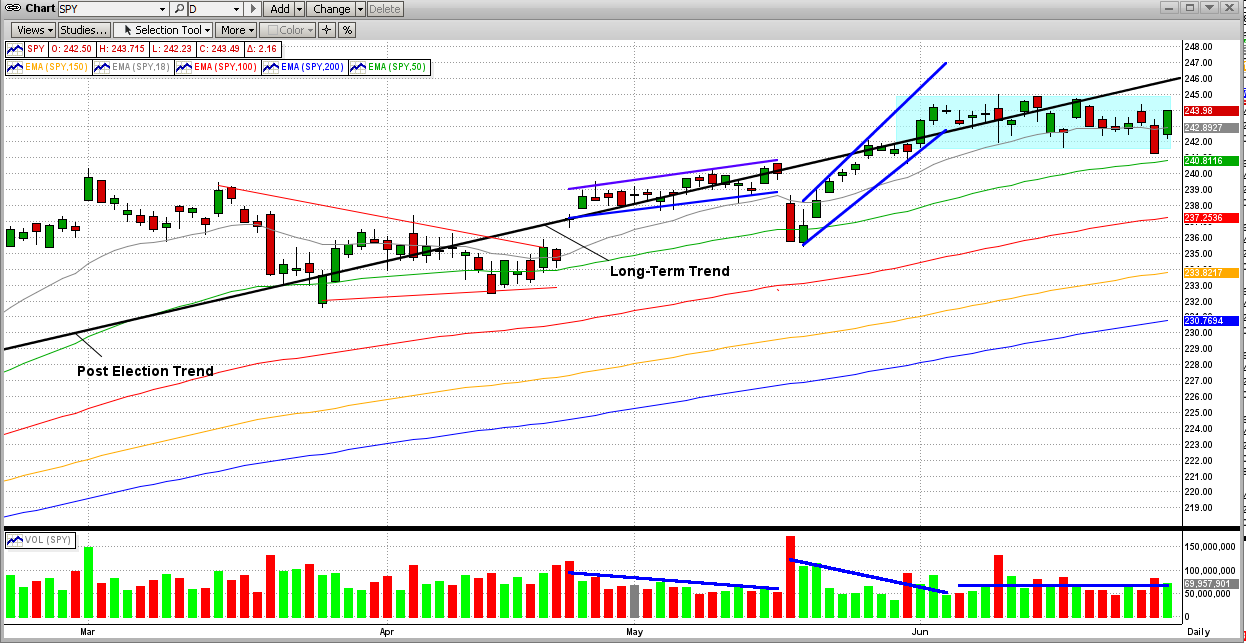
- Graph #1 is a daily graph for the last four months (Mar-June 2017), and
- Graph #2 is monthly graph going all the way back to 1997
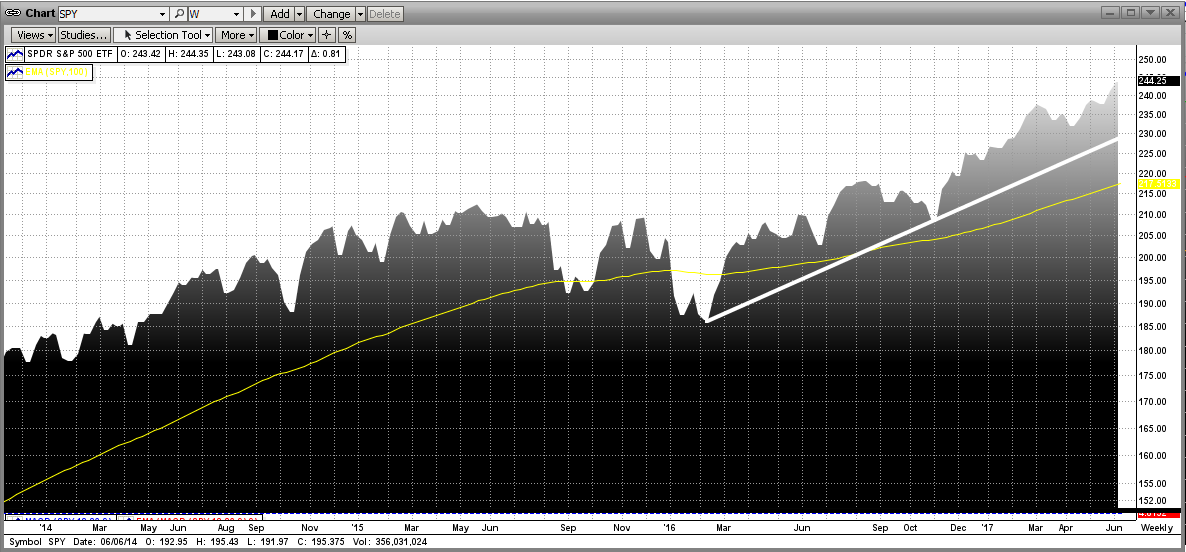
GRAPH #1
In the graph immediately below, the straight black line is the long-term trend line, and
the gray, green, red, orange and blue lines are EMAs:
- the grey line is the 18-day EMA,
- the green line is the 50-day EMA,
- the red line is the 100-day EMA,
- the orange line is the 150-day EMA, and
- the blue line is the 200-day EMA
What we can see from this is:
(a) The trend is going up "slowly", but may be getting weaker (market below trend in late-June)
(b) The moving averages:
- are moving almost perfectly "in sync" with each other,
- are keeping their individual "slopes", and
- are not getting weaker or converging with each another.
(c) The two observations above are bullish, but the market appears to be flattening out (bearish)
Read on...
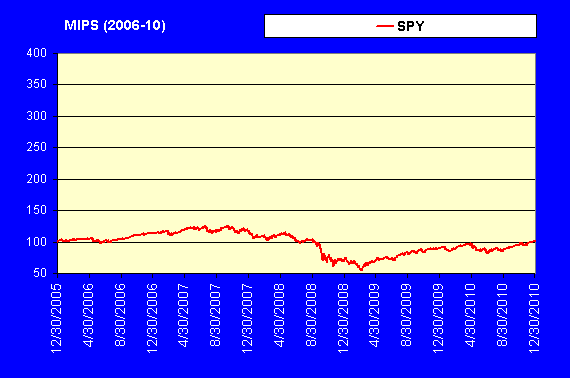
GRAPH #2
There is not enough in the above to make me feel comfortable, so lets "back away" and look at the market from a longer-term view. The view below covers almost 20 years (1997-June'07) and, of course, it contains the big market crashes in 2000 and 2008.
Read on...
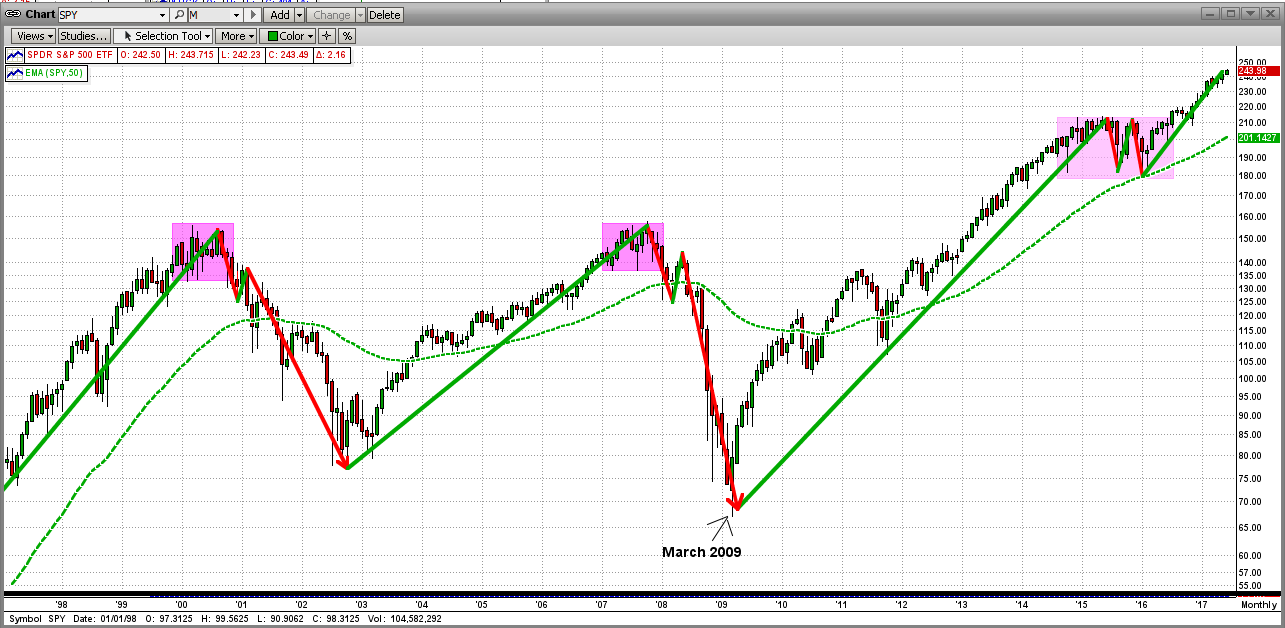
As you may know, real bear markets do not just happen immediately and out of the clear-blue sky. Two things are usually required: bad economic fundamentals and a "catalyst" to bring it about (like the Lehman Brothers failure, etc). Bear markets do not happen when the economy is booming. Stock prices go in the same directon as profits, period. That is, stock prices rise with increasing profits and stock prices fall with decreasing profits.
But stock prices "lead" in this relationship, as the very largest investment firms (Goldman Sachs, Morgan Stanley, etc) start selling before bad earnings numbers are realized and announced to the world of investors. Did you ever wonder how these big guys (aka Fat Kats) know when American companies are going to announce lower earnings (yeah, what a surprise). Maybe, just maybe, it is because these big American companies are their customers and somehow the fat kats figure it out (haha) at our expense.
At any rate, in Graph #2 above, it can be seen that what I call "topping" takes 9-15 months to complete a "turn-over", and then a catalyst comes along and takes the bottom out. The toppings in 2000 and 2008 were almost identical, and it appeared that the topping in 2015 (fake) would occur again. But it did not, thanks to the Presidential election; which sort of acted like an "anti-catalyst". This was because of the strong probability that Trump would strengthen the economy (lowering taxes, infrastructure spending, renegotiating or leaving foreign agreements, etc.). Now, if that fails, this "anit-catalyst" could become the catalyst for a big drop.
Of course, anything could happen from here...
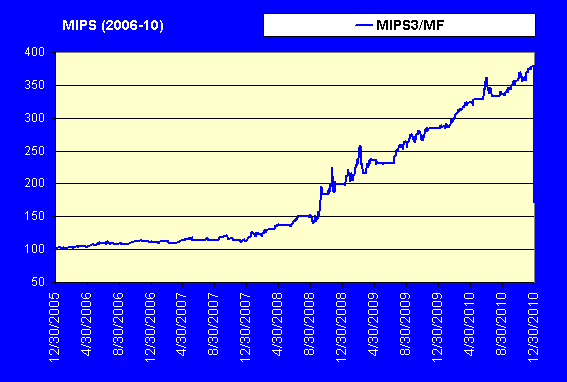
- and that is why we need MIPS...
- MIPS is 1,000 times more complex and accurate than the simple analysis herein.
SURVEY
- WHAT DO YOU THINK???
We are asking all MIPS Members and followers to submit their opinions in an email reply, and we will share the results with all.
What is your opinion regarding market performance (S&P 500) in the next 18 months?
- please send us your best guesses for 12/31/2017 and 6/30/2018
------------------------------------------------Pick one for each year
Performance.......................................Dec 2017....June 2018
#1) Grow greater than +15%
#2) Grow between 0% and +15% x
#3) Fall between 0% and -15%
#4) Fall between -15% and -30% x
#5) Fall more than -30%
Example Answer................................. #2 for Dec'17 #4 for June'18
Thanks
Best Wishes...
Paul Distefano, PhD
MIPS Timing Systems, LLC
Houston, TX
281-251-MIPS(6477)
support@mipstiming.com