Anyone who has developed and programmed a mathematical model for managing a real-life process (like controlling a nuclear power plant, controlling a jet aircraft, sending a man to the moon in a spaceship, or forecasting changes in the direction of the stock market), knows the criteria for a good model.
The main conditions for a good model are:
1) the math has to realistically represent the actual situation that it is controlling/predicting,
2) it must be written to represent the real situation, and be tested against real data (or close to real data),
3) the backtesting cannot actually result in "curve-fitting",
4) it has to be update-able to work with "new" data,
5) the model should have built-in self-learning and self-correcting algorithms, and
6) the model needs to contain algorithms that stop the main model if it is not working properly and switch
to others.
Given the above, all good developers frequently forward-test their models against known and unknown changes in the environment (in our case, erratic market behavior). To that end, we are always looking at how our models might work in a new market crash. On average, investors face a market crash almost every 7 years (the so-called "Seven Year Market Cycle"). This comes from market data over many years that shows that the market continually goes up in cycles of 4-6 years up and 1-2 years down (say an average of 5 years up, then 2 years down). We should know, as we have faced two almost perfectly devastating 7-year market cycles in this very young century.
And, on this basis and many others, the 6-year bull market we are in is overdue for a big crash. And yes, we are aware that a bull market can last for 10-12 years as in the 1980's and 1990's, but the 7-year cycle is much more popular than 12-year bull markets. So, that leaves us highly vulnerable this year.
Even if we are not vulnerable to a big drop in 2015, as developers of the MIPS models we want to make sure that MIPS is ready if and when a big drop does happen. It is better for the MIPS models to fail to identify a major crash in forward-testing than in real life. At least we would have a chance to "fix it" before it happens, rather than after.
So, we dug back in time and used some real data from previous market crashes to see how MIPS would perform if the market started down now. We are pleased to say that the MIPS4 model would have performed nearly PERFECTLY (see below). [The MIPS3 and MIPS/Nitro models also did well, but their results are not shown herein.]
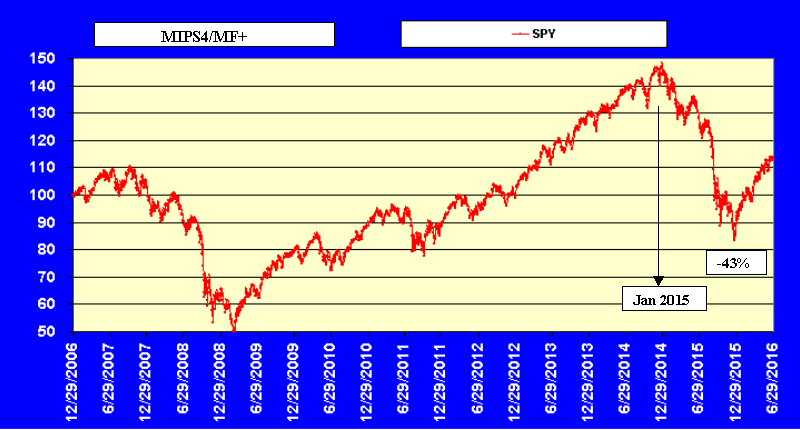
HYPOTHETICAL MARKET CRASH IN 2015
In the graph below from 2007-6/30/2016, the data through 12/31/14 is real SPY data (in % changes), and
the data from Jan 2, 2015 to about 12/31/2015 is our assumed drop in the S&P 500 (rebounds after).
- you can see that our "test data" included a -43% drop in the S&P 500 in the full year of 2015, and a
rebound of +22% over the next 6 months (through to 6/30/2016).
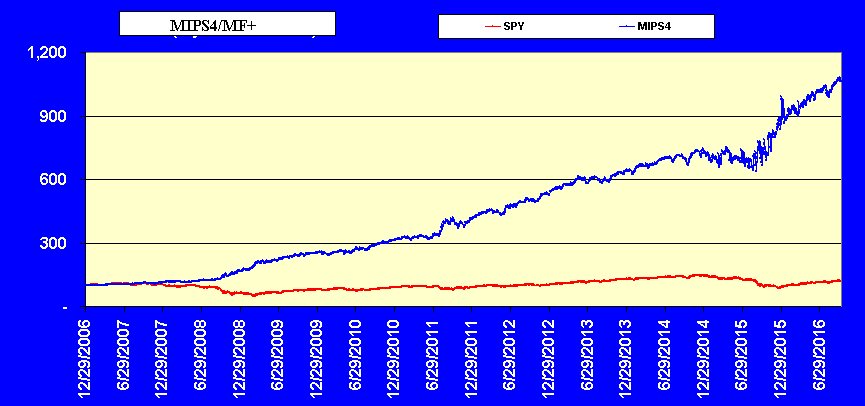
MIPS4/MF+ PERFORMANCE IN MARKET CRASH OF 2015
So, how did the MIPS4/MF+ model perform in this assumed (but highly possible) drop. The graph below makes us prematurely proud (only to be really proud when it does what it is designed to do in the next real market drop).
Performance of MIPS4/MF+ in the assumed market crash of 2015.
In 2015-6/30/16, MIPS4 would have been up about +55% (made money on the dip and on the rebound).