Remember, "The trend is your friend" !!!
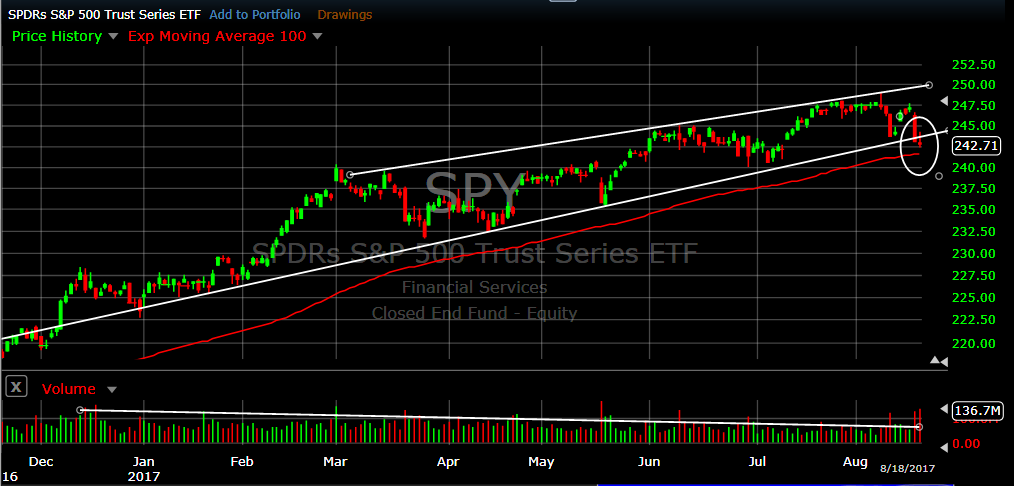
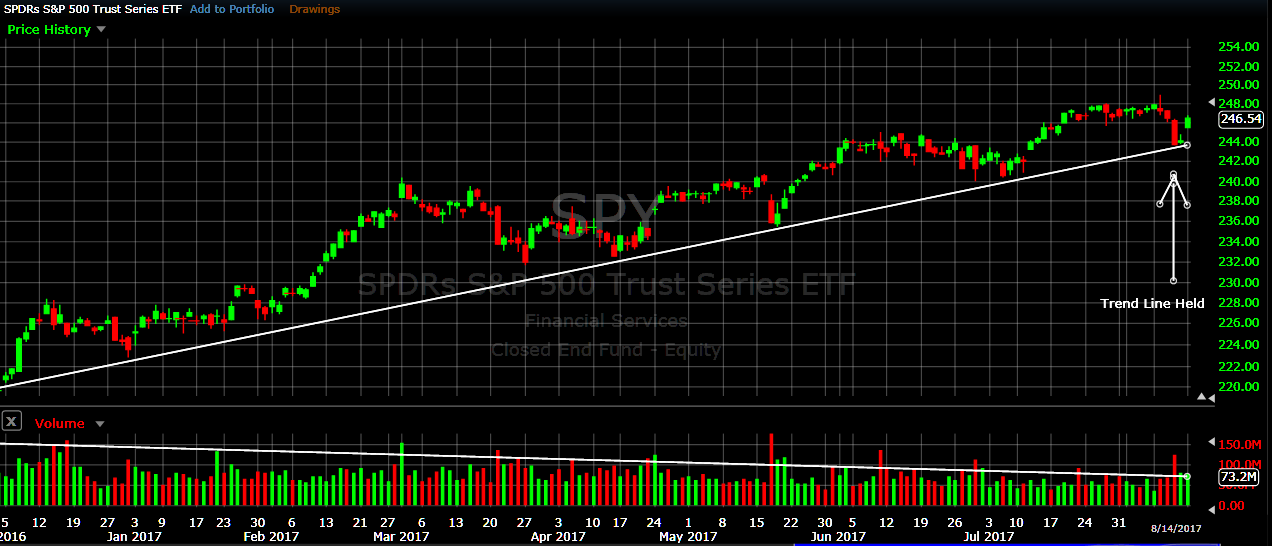
The market (S&P500 ETF SPY), held its trendline last week and bounced off its trend to the upside today.
- holding above the trend is very bullish, but
- ever decreasing volume is slightly bearish.
Don't fight the Trend...
- MIPS Members can see what MIPS did at http://www.mipstiming.com/current_signals
Paul Distefano, PhD
MIPS Timing Systems, LLC
Houston, TX
281-251-MIPS(6477)
=============================================================
<<< Blog from 8/06/2017 >>>
MIPS Members:
The long-term market trend is UP, and in up markets almost every investor has been told "don't fight the trend". But, of course, all trends come to an end, and that is what leads to market cycles and even market crashes. This upside trend has lasted for well over a year, with historically low volatility, and may be ready for at least a correction. See the graph below for the market (SPY) movements over the last 9 months.
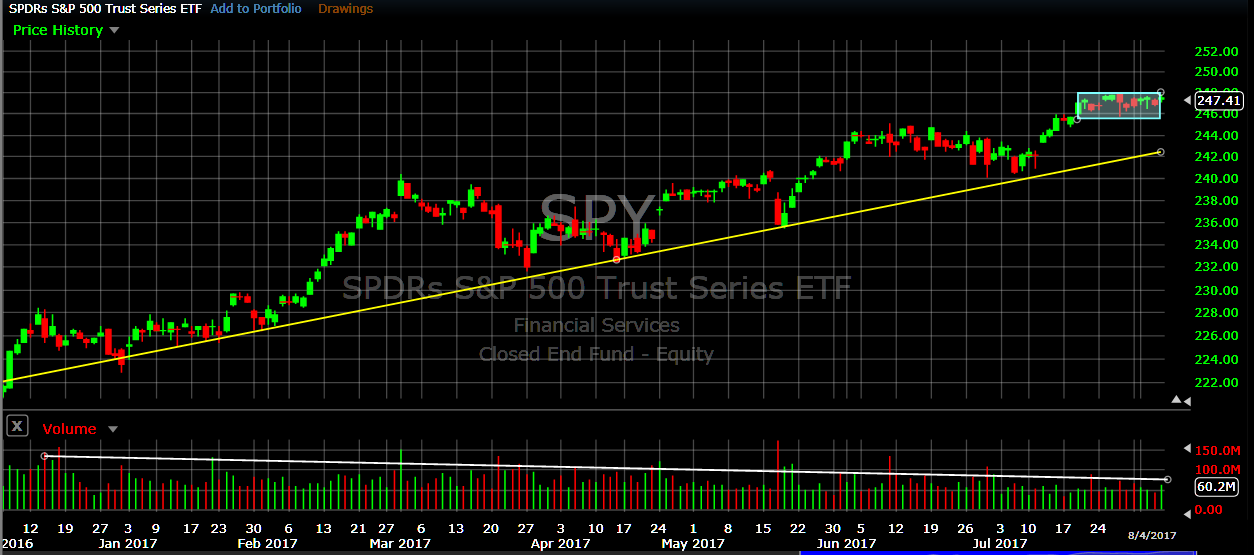
It can be seen above that the market has followed a near-perfect uptrend, with higher highs and higher lows. However, the daily volume in this time period has dropped nearly 40%, and this is not a good sign from the Big Guys.
MIPS xRay View
And, in the last couple of weeks, the market seems to be flattening-out. For this, let's "zoom-in" and go into our xRay view to see an example of what's going on under the skin in a certain part of the MIPS models (see graph immediately below).
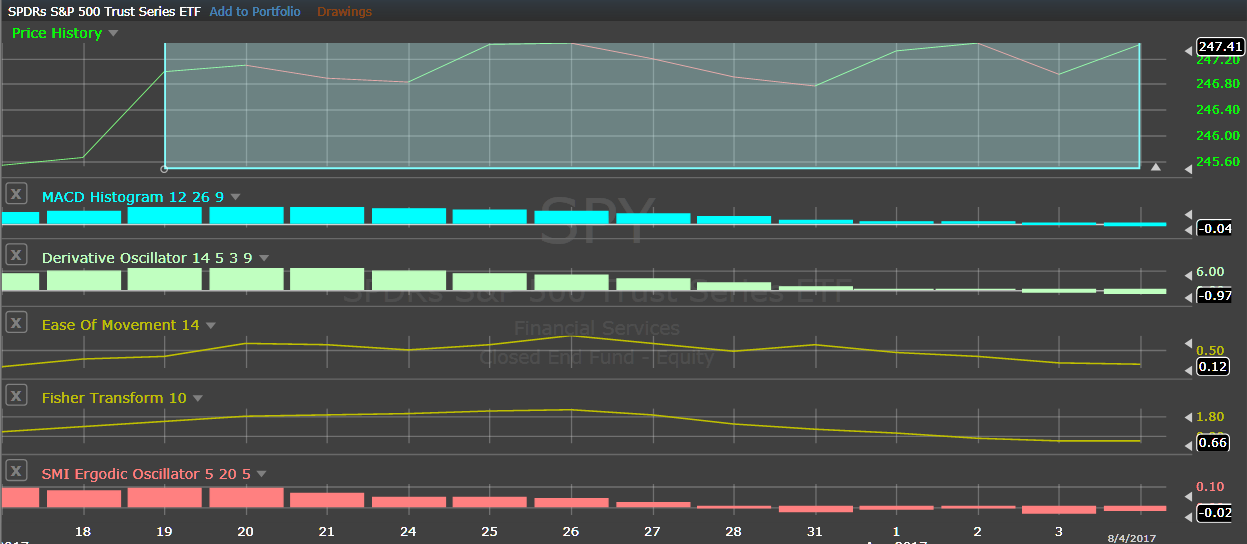
When we take the volatility out of the price action of the SPY over the last two weeks as done above, we see that the market closes have indeed been VERY flat. From this, one might expect that the indicators in the MIPS models are also flat (like not moving up or down). In actuality, you can see that ALL of the five indicators above are decaying from positive to negative (or close to zero). This could indicate that the uptrend is decaying. Of course, this is a VERY small part of a MIPS model (5 out of over 150 indicators and lots of math), and other parts of the models are signaling that the market still has steam. For example, see the MIPS Market Strength Indicator (MSI) below.
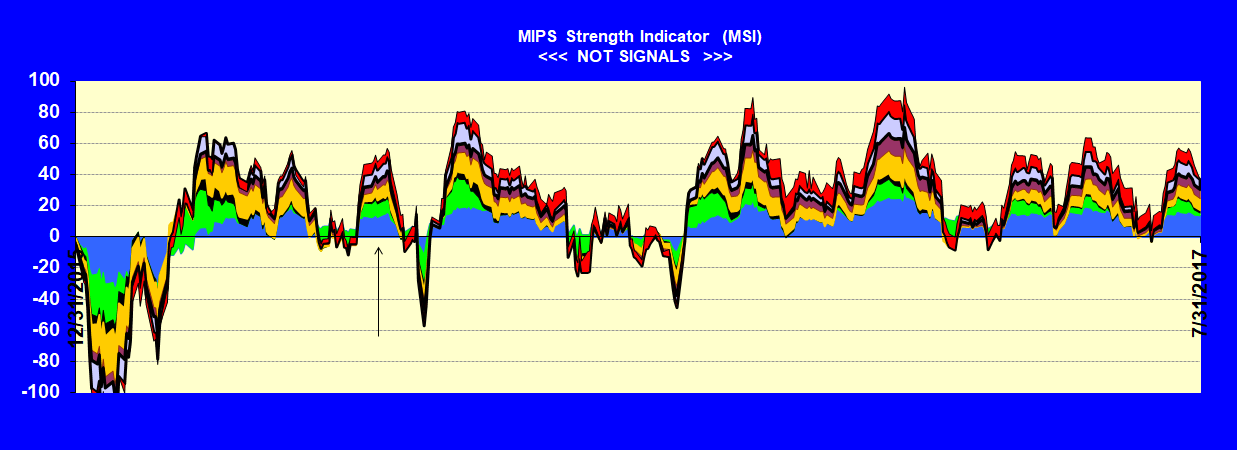
MIPS Market Strength Indicator (MSI)
The MSI graph below shows the relative strength of 8 of our best indicators. These are showing a neutral to positive view of the market direction at this time, and never went seriously negative since early 2016.
.
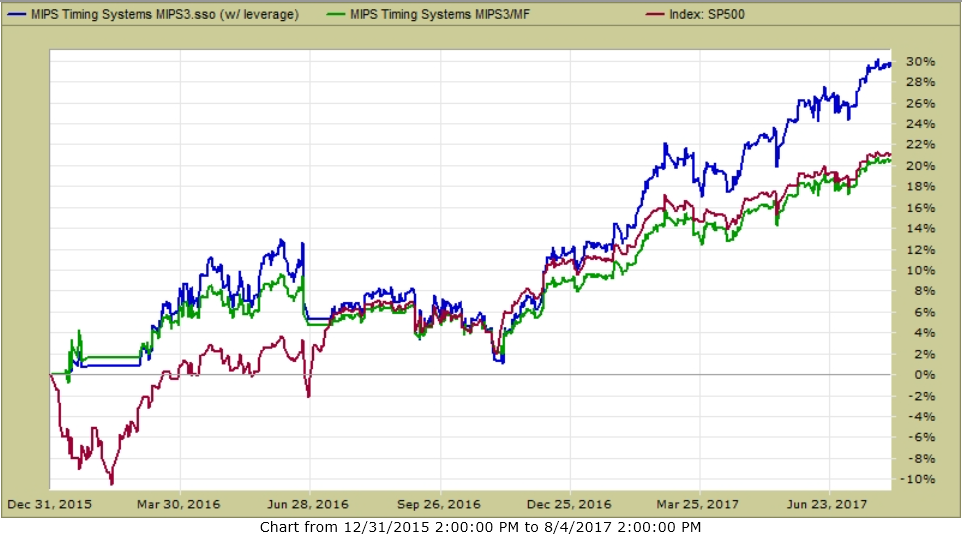
MIPS3 Performance 2016-2017 YTD
All of the MIPS models are still Long, and the performance since 2016 has been very good.
Of course, we will continue with the Long signal from MIPS until MIPS changes its mind.
MIPS3 - 2016 - 08/04/2017
(Trading SPY Long / Short)
Blue Line 1.5x Long / 0.5x Short +30.0%
Green Line 1.0 x Long / 1.0x Short +20.5%
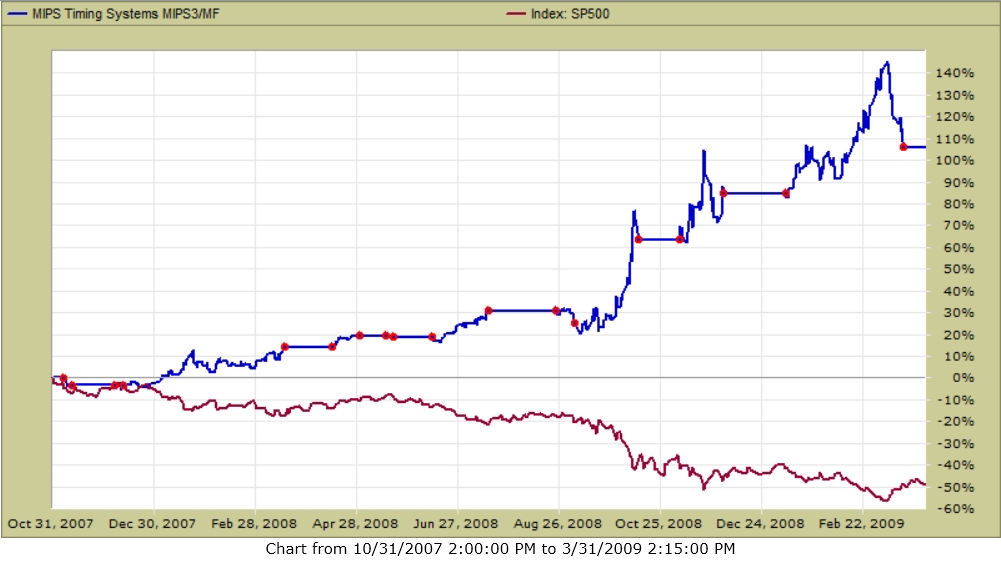
MIPS3 in 2008
And, don't forget how MIPS3 did between Oct'07 and Mar'09 (see graph below).
SPY -50% MIPS3 +108%
CONCLUSION:
MIPS's position is that the market still has an upward bias, and we expect more growth from this market. But, MIPS is seeing some aspects of a neutral or decaying trend. From the above, you can see that MIPS is doing whatever it needs do to to ascertain when the market is going south, and then getting us out. This is the time when you make big bucks using good timing models, like MIPS3 and MIPS4.
Stay tuned...
Best Wishes !!!
Paul Distefano, PhD
MIPS Timing Systems, LLC
Houston, TX
281-251-MIPS(6477)