Sunday, November 25 2018
All investors want to know which way the market is (and will be) moving. But, most do not care "why" the market is doing what it is doing. On the other hand, some investors are trying to figure out why the market is doing what it is doing. Some concentrate on "fundamentals" and others on "technical analysis".
"Fundamentals" include things like the condition of the economy, corporate earnings growth, employment, consumer confidence, international relationships, politics, etc. Of course, you have no trouble getting inundated with info about these from talking heads, advisory services, emails, etc. However, once you get all of this "stuff", you still have to determine which way the market will move given all of the info above, and when !!!
At MIPS, we concentrate on "technical analysis" which means that we are calculating which way the market will move going forward compared to today's movements. Since we are using hundreds of technical indicators, applied mathematical equations, artificial intelligence, pattern recognition, volume weighting, etc., we can project the market in the near future based on the outcome of the above. For example, our "volume weighting" algorithms tells us if a big price change in the market on any given day (like in the S&P 500, SPY) was caused by trading from "the pros" or from us "little guys". Along with hundreds of our other algos, the MIPS models are highly successful in calling directional changes in the market (like with 65-70% accuracy), and the winning trades are over three times more profitable than the losses on losing trades.
ACTUAL FLAT MARKETS
Given the above, the question "what kind of market" are we in takes the front row. So, "what kind of market" are we in? The short answer is that we are in what is called a flat, sideways, horizontal, or trendless market, which means a market that has gone up and down in a tight trading range of something like plus or minus 3-6% around a meanline (or mid-line) for several months. See "example" below.
FLAT MARKET IN 2015
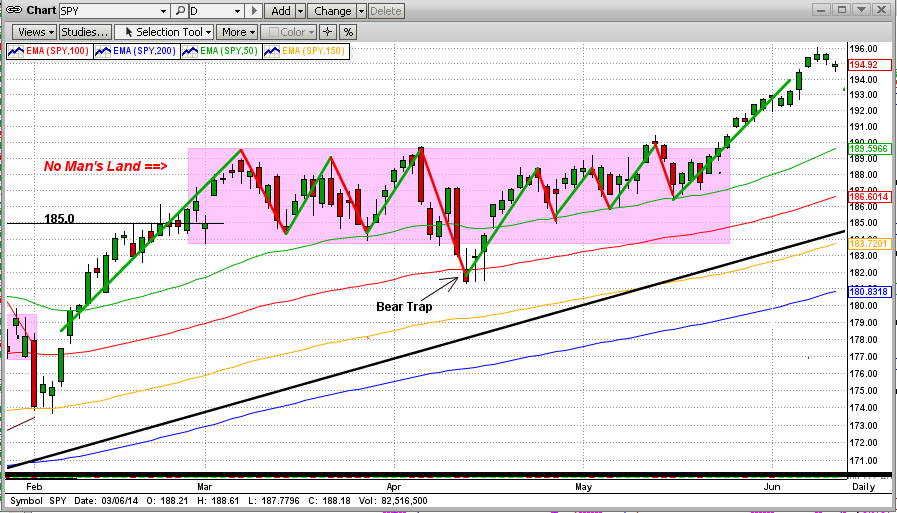
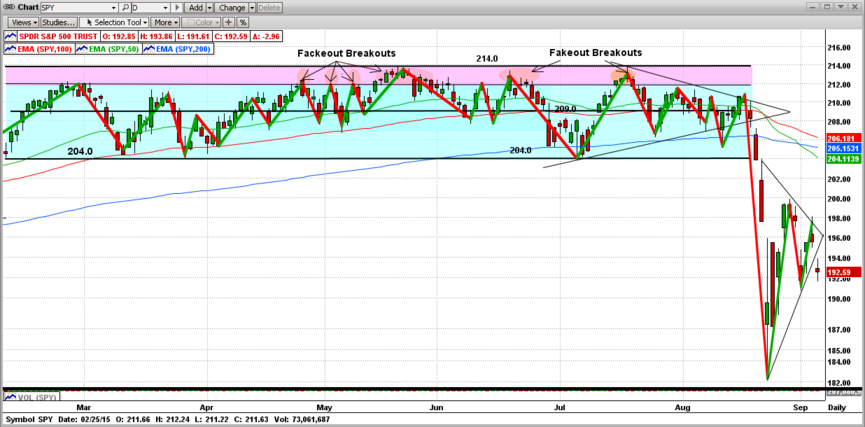
Flat/Sideways markets can be very dangerous to trade in, especially those that change direction every few days (like every 4-7 days). We call these High Frequency Directional Change (HFDC) patterns, and this is where most non-suspecting models get whipsawed badly. In 2015, the Dow changed direction 29 times in the first 9 months, which caused most models bad headaches (like that below). Since that time, we have built in multiple algorithms to limit trading with the MIPS models in flat markets.
FLAT MARKET IN 2018
What is going on in the market now? Let's look at this from both a long-term and short-term view.
Long-Term View
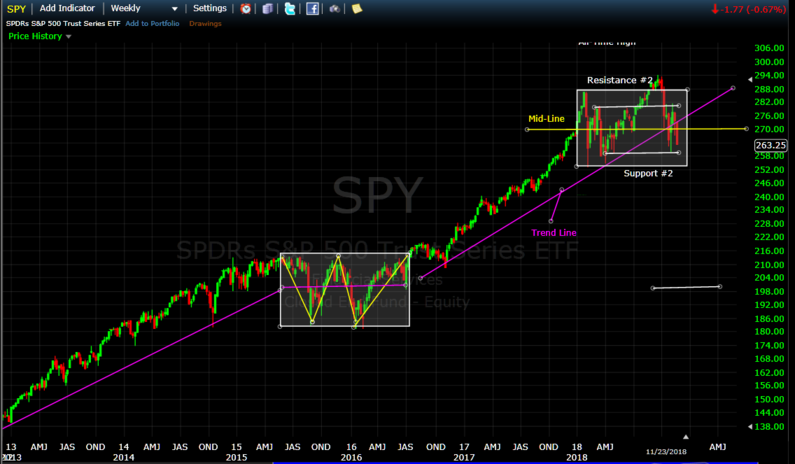
When looking at the SPY with a long-term view (immediately below), the flat/sideways pattern is obvious, as it was in 2015. The flat market in 2015 ultimately broke to the upside, but we will have to wait to see what happens now.
Short-Term View
The graph below shows the "mess" that we are in now. This market has crushed many timing models, because it has no predictable "direction". Fortunately, the "Blaster Series" algorithms that we implemented in 1Q'16 have protected the MIPS models from trading in markets like this. Now, the MIPS models either stay in the position they were in when the flat market started, or they go to cash when the market movements make no sense at all (like now).
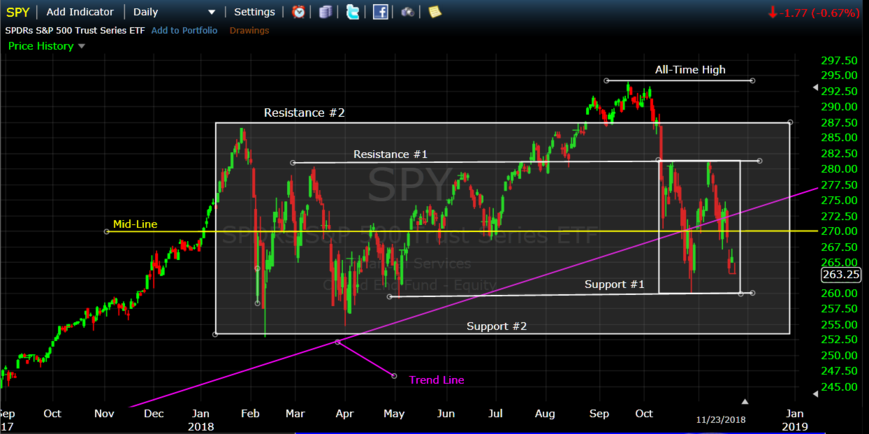
In the graph below, you can see that the SPY has traded between $253-278/share since Jan'18 (approximately plus or minus 5%, between resistance/support #2). And, if you look closely at the smaller trading range that we are in now in the right side of the graph below (with support#1 and resistance #1 between $260-280), you will see no trend or meaningful pattern (which means that the next market move is highly unpredictable). However, a break of the #1 support/resistance lines will at least deserve immediate extra caution.
The MIPS models haved remained Long since Apr'18 and issued a "Cash" signal on 11/13/18, to have been executed on the open on 11/14/18 at $274.16/share. Remember, the cash position can change at any time.
So far, our last signal is a profitable one, and the future remains unpredictable now. But, that can change on any given day, so be careful and watch for MIPS Signal Change emails.
And remember, when tradiing actively, "Money not made is NOT the same as money lost" ...
- so, it is better to sit on the sidelines than to trade and lose.
Good trading...
Paul Distefano, PhD
CEO / Founder
MIPS Timing Systems, LLC
Houston, TX
281-251-MIPS
www.mipstiming.com
Sunday, November 11 2018
It seems like everyone (at least almost all MIPS members) are deathly afraid of a fast market crash from today's levels. Fortunately, that is not usually the way market crashes happen (and there is a good reason why). I say usually because the market can do what it wants, when it wants. But, understanding human nature and previous market behaviors under similar circumstances can be helpful.
First off, market crashes do NOT just fall out of the sky on any given day. A market "topping" that leads to a 1-2 year bear market (40-60% drop), takes 10-12 months to "prepare" for the drop. See the market "toppings" and crashes for the SPY from 2000 and 2008 in the graph below.
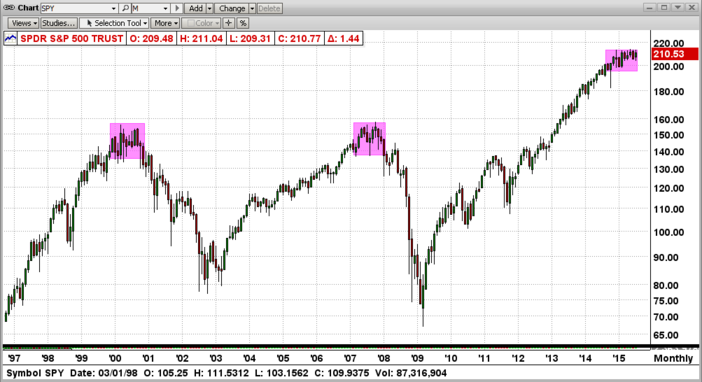
"TOPPINGS"
In the above graph from between 1997-2016, you can see the 12-15 months "toppings" that led to the bear markets in 2000-2008. During these "topping" stages, the market "waffled" for 10-12 months before falling apart. Everyone that studies market behavior through quantitative analysis has their own opinion, but I am 90-95% sure that the topping period lasts 10-12 months because (and only because) it takes the FAT KATS (Morgan Stanley, Goldman Sachs, etc) that long to dump a sizeable portion of their holdings or at least to re-allocate their holdings. After that, the fat kats open the gates and us little guys fall through the bottom. In 2015, the fat kats changed their minds after about 1/2 of the way thru the "topping" period and decided to reverse their course (leading, of course, to many new highs through 2Q'15).
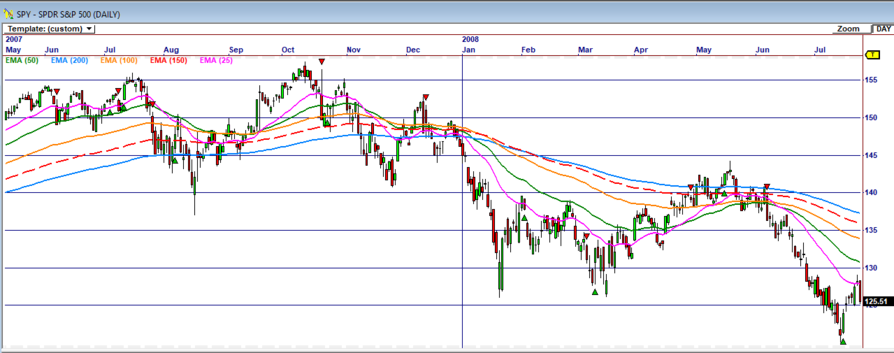
During a topping or roll-over period in the market (if that is what it is), a good timing model (or technical analyst) can see the "slow" deterioration of the market. See one simple example of the market rollover (SPY) in the market crash of 2008 (graph immediately below). In mid-2007, the 25-50-100-150-200 day exponential moving averages were aligned to where the short-term moving averages were above all of the long-term ones (as in all up-markets) until the market got weaker-and-weaker. At the beginning of 2008, the entire group of moving averages "inverted" themselves (flipped) to where the short-term averages were on the bottom (as in all down markets). After the moving averages "inverted", the market experienced a horrific ride to a -55% bottom !!!
TODAY
The possibility of a big market "drop" now or in the very near future, is not nearly as justified as it was in 2007 (we are in what is more likely a sideways or horizontal market). The short-term averages (like the 25-day and 50-day EMAs) have just started to penetrate below the long-term average space, and most likey all will turn around before dropping more.
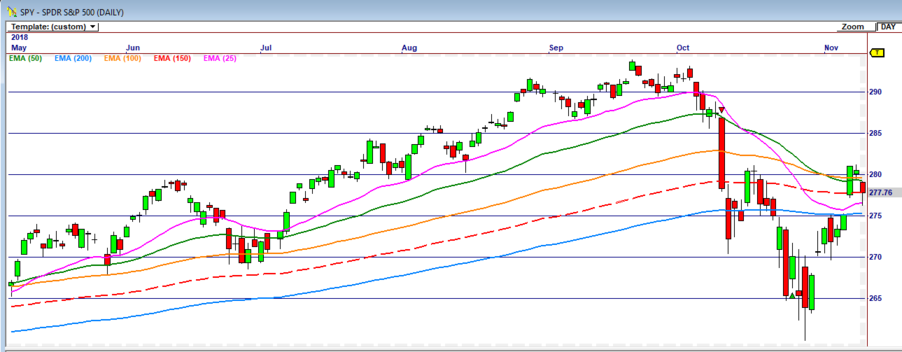
From the above, there is no indication that the market is close to a "crash" at this time. See the graph above, and remember that the market can do what it wants, when it wants.
SO, WHAT DO WE DO?
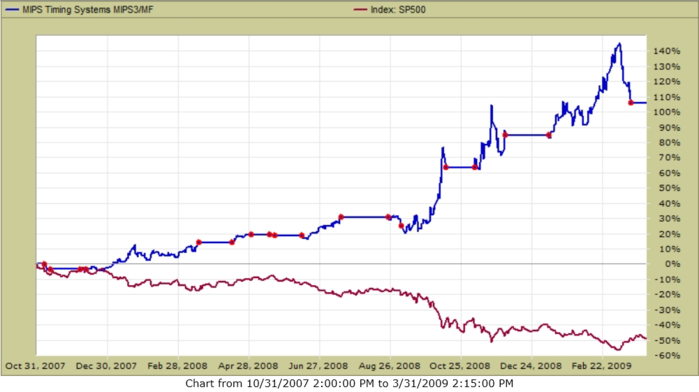
In a market crash, MIPS is designed to go short somewhere around a 10% drop, and recover after ABOUT a 10% recovery. This means, for example, that if the market is down -55% and MIPS takes 10% on each end to issue trade signals; and if MIPS performs as designed, MIPS would be up +35% when the market is down -55%. Between Oct'08 and March'09, the SPY was down about -50% and MIPS was up over +100% (it caught some "upticks" in this bear market). See below:

Example:
The above is an close examination of the behavior of the 25-50-100-150-200 day EMAs, but it is only ONE of the indicators/algorithms that are used in the MIPS models. Please remember that MIPS uses OVER 200 technical indicators and mathematical algorithms to determine if the market is moving up or down !!!
Good trading...
Paul Distefano, PhD
CEO / Founder
MIPS Timing Systems, LLC
Houston, TX
281-251-MIPS(6477)
pdistefano@gmail.com
www.mipstiming.com
Wednesday, November 07 2018
The one "indicator" that is almost 100% accurate notes that:
"Markets Don't Crash when Economic Fundamentals (like profits) are Good" !!!
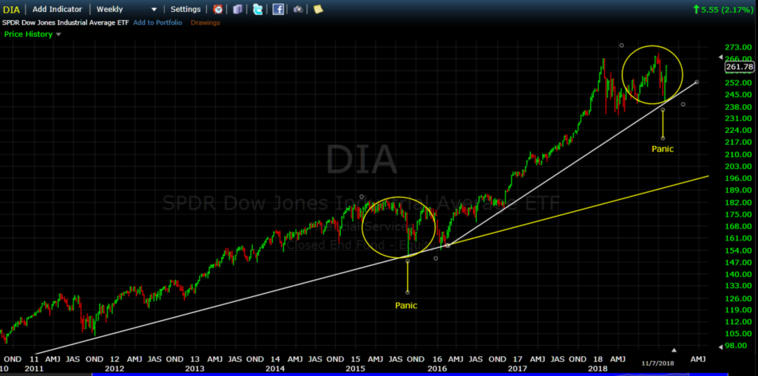
Since the Presidential election in 2016 to the mid-terms in 2018, corporate profits and jobs have risen at a rapid pace, followed by almost a "straight-line" in rising stock prices. Take a look at the Dow graph immediately below. Who would have wanted to sell or go short in a market like that since the beginning of 2016 ?
Yes, there were some big dips along the way, but they were ALL above the trendline. Please understand that a drawdown above the trendline is NOT the same as a drawdown below the trendline. Since Jan'18 the market has moved in a "sideways" pattern, which is a perfect market to get whipsawed in by trying to time and trade the ups and downs in a tight, volatile pattern.
In markets when it was "the right time to go short" as in 2008, MIPS did its job and was up more then 100% when the SPY dropped 50%. Tests show that MIPS would perform in a way similar to that again in the next market crash.
2008
MIPS is a trend-following model and as such it has a "bias" to market trends above the trendline (as it should). Since the Nov'16 elections, the MIPS models have not traded very often, mainly because the market has closely followed a tight, solid upward trend for the last 10 years, with even higher upside acceleration since Nov'16.
Some MIPS members have questioned our low number of trades in the last two years, but there were simply very few good, technical reasons to do so. And, please remember that whenever MIPS stays with the same signal (like our few Long signal in the last few years), it is not because MIPS is in any way "following" past signals. The MIPS models go through several 100's of calculations every day to determine the direction of the market. And, when the trend is up, the MIPS signals are Long and vice versa when the trend is down. Of course, it makes no sense to trade more times in any give year than the number of times that the trend changes direction!!!
Aside from that, third party "Tracking Companies" (like TimerTrac.com) post evidence that models that trade more than like 20-40 times/year often do very poorly over a long-term period. MIPS3 is the #1 Model on TimerTrac.com since 2007 (up over 400% with 131 trades in the last 11+ years); whereas the model in 25th place was up only 35% with 1393 trades in these 11+ years. There are other models that have traded over 100 times/year that have performed poorly or even lost money in this same time period. Go to => https://www.mipstiming.com/bu___1_ranked
Notwithstanding the above, here is how has MIPS3 performed since the Presidential election in Nov'16:
MIPS3 - trading SPY Long/Short (no leverage)
SPY
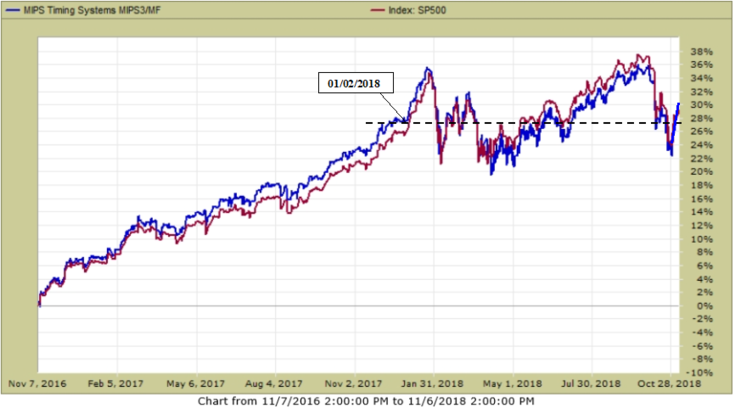
As you see above, MIPS3 is up about 30% since the Presidential election in Nov'16. It "weathered the storm" and was up a little in the sideways market in 2018. This is quite an accomplishment, because many models that tried to trade this volatile, trendless market long and short in 2018 got cremated.
So, the moral of the story is: "Do not take this journey by yourself". Find a good timing model, or simply use one of the very best models on the retail market, MIPS4 (or MIPS3).
Good trading...
Paul Distefano, PhD
CEO / Founder
MIPS Timing Systems, LLC
Houston, TX
281-251-MIPS(6477)
|


