It seems like everyone (at least almost all MIPS members) are deathly afraid of a fast market crash from today's levels. Fortunately, that is not usually the way market crashes happen (and there is a good reason why). I say usually because the market can do what it wants, when it wants. But, understanding human nature and previous market behaviors under similar circumstances can be helpful.
First off, market crashes do NOT just fall out of the sky on any given day. A market "topping" that leads to a 1-2 year bear market (40-60% drop), takes 10-12 months to "prepare" for the drop. See the market "toppings" and crashes for the SPY from 2000 and 2008 in the graph below.
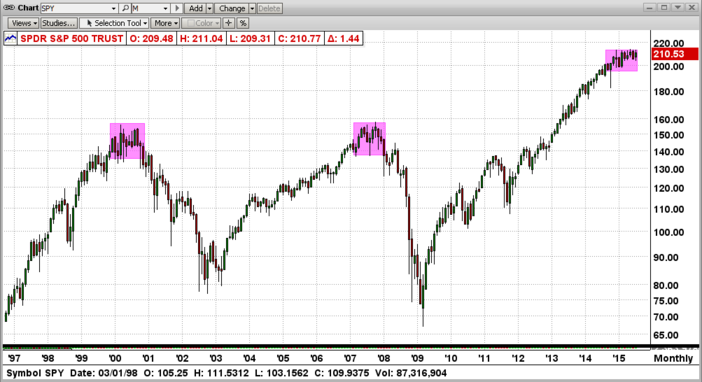
"TOPPINGS"
In the above graph from between 1997-2016, you can see the 12-15 months "toppings" that led to the bear markets in 2000-2008. During these "topping" stages, the market "waffled" for 10-12 months before falling apart. Everyone that studies market behavior through quantitative analysis has their own opinion, but I am 90-95% sure that the topping period lasts 10-12 months because (and only because) it takes the FAT KATS (Morgan Stanley, Goldman Sachs, etc) that long to dump a sizeable portion of their holdings or at least to re-allocate their holdings. After that, the fat kats open the gates and us little guys fall through the bottom. In 2015, the fat kats changed their minds after about 1/2 of the way thru the "topping" period and decided to reverse their course (leading, of course, to many new highs through 2Q'15).
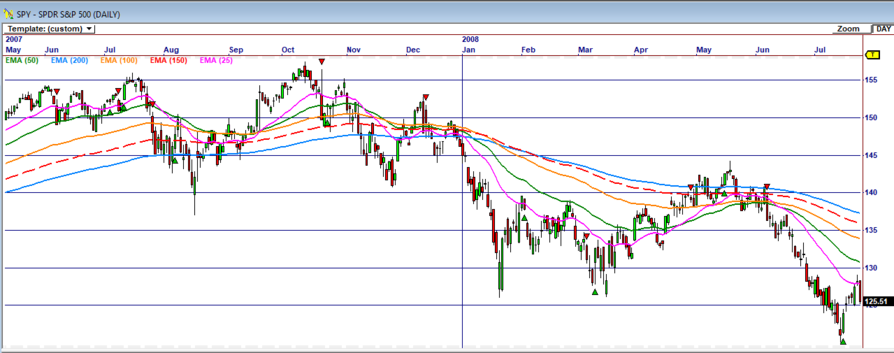
During a topping or roll-over period in the market (if that is what it is), a good timing model (or technical analyst) can see the "slow" deterioration of the market. See one simple example of the market rollover (SPY) in the market crash of 2008 (graph immediately below). In mid-2007, the 25-50-100-150-200 day exponential moving averages were aligned to where the short-term moving averages were above all of the long-term ones (as in all up-markets) until the market got weaker-and-weaker. At the beginning of 2008, the entire group of moving averages "inverted" themselves (flipped) to where the short-term averages were on the bottom (as in all down markets). After the moving averages "inverted", the market experienced a horrific ride to a -55% bottom !!!
TODAY
The possibility of a big market "drop" now or in the very near future, is not nearly as justified as it was in 2007 (we are in what is more likely a sideways or horizontal market). The short-term averages (like the 25-day and 50-day EMAs) have just started to penetrate below the long-term average space, and most likey all will turn around before dropping more.
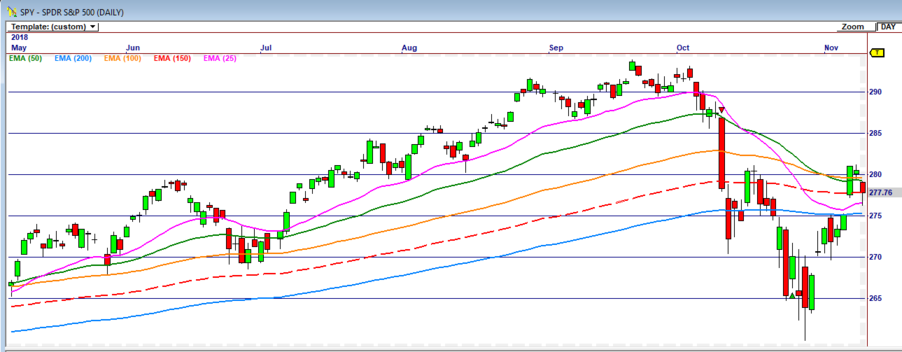
From the above, there is no indication that the market is close to a "crash" at this time. See the graph above, and remember that the market can do what it wants, when it wants.
SO, WHAT DO WE DO?
In a market crash, MIPS is designed to go short somewhere around a 10% drop, and recover after ABOUT a 10% recovery. This means, for example, that if the market is down -55% and MIPS takes 10% on each end to issue trade signals; and if MIPS performs as designed, MIPS would be up +35% when the market is down -55%. Between Oct'08 and March'09, the SPY was down about -50% and MIPS was up over +100% (it caught some "upticks" in this bear market). See below:
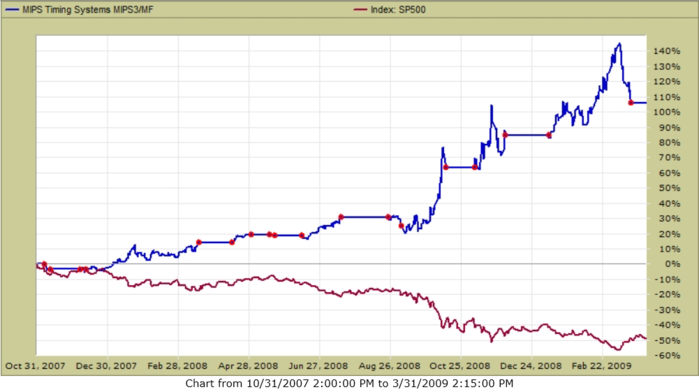
Example:
The above is an close examination of the behavior of the 25-50-100-150-200 day EMAs, but it is only ONE of the indicators/algorithms that are used in the MIPS models. Please remember that MIPS uses OVER 200 technical indicators and mathematical algorithms to determine if the market is moving up or down !!!
Good trading...
Paul Distefano, PhD
CEO / Founder
MIPS Timing Systems, LLC
Houston, TX
281-251-MIPS(6477)
pdistefano@gmail.com
www.mipstiming.com


