Monday, February 11 2013
Everyone pretty much agrees that this market is overbought, and most expect a pullback soon. Most likely, investors agree that the market is overbought, but all do not agree on what will happen from here.
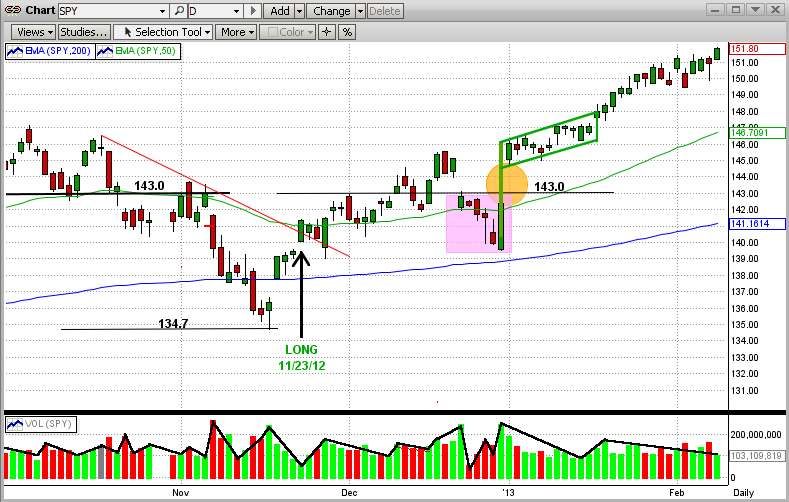
When we look at the graph below, we can see that the SPY bottomed out at $134.7/share on 11/19/12 (MIPS3/MF went LONG on 11/23/12). Since then, the SPY:
(a) formed a new intermediate-term uptrend,
(b) broke the then recent triple top neckline at 143.0,
(c) fell into a short 5-day "bear trap" (purple box),
(d) gapped up and formed an up-pennant pattern,
(e) broke out of the up-pennant pattern to the upside, and
(f) formed a new, definitive uptrend.
The resulting performance from the SPY in this wild ride over the last 2-1/2 months is a healthy gain of 12.9%. And, this performance was not restricted to just the large-cap stocks in the SPY, as the Russell 2000 did even better. Of course, Apple put the brakes on the NASDAQ performance, but it was still up nicely.
The above is enough for most traders to declare that "the market" is overbought, at least in the short-term. It would be difficult for anyone to disagree with that. But, as always, there is another sneaky little option hiding in the numbers.
Looking a little closer at the volume during this run-up, we see that the market run-up has been on low volume. For example, the recent SPY volume has been only about 75% of its average volume. This decisively says that the run-up was the result of buying by the little guys rather than the big guys. And, I also believe that this is exactly what the big guys have been waiting for. If this keeps up, and if the SPY reaches or breaks its all-time high of $157.5/share from Oct'07, it could lead to euphoric buying by the little guys who missed the bull market of the last 4 years; thus pushing the market to record highs. Of course, this is exactly what the big guys want. THEN, they will dump their holdings at the very top one more time.
If you don't think this can happen, think again!!! To those who have not been trading for the last 15-20 years, this might not seem possible. But, I was right in the middle of Silicon Valley in the late 1990's when investors pushed Cisco System's stock price up to where its P/E ratio was 400 and Yahoo's market value was higher than the GDP of Iceland. What this shows is that it "is" possible for hyped-up buyers to push an already high, overbought market even higher.
This poses two very different outcomes (also see the take on this by the "pros" in the articles below).
Conclusion: Let's wait for MIPS to determine a new trend and tell us what to do.
Paul Distefano
EXCERPTS FROM RECENT ARTICLES
---------------------------------------------------------------------------------------------------------------------------------------------
I. Is This the Death Knell for the Bull Market?
by Alexander Green, Chief Investment Strategist
Friday, February 8, 2013
www.investment-u.com
Well, it had to happen eventually. The average punter is finally returning to the stock market. TD Ameritrade registered an average 370,000 trades per day in January, up from 30,000 trades a day in December. And, according to data from TrimTabs Investment Research, investors funneled $55 billion into U.S. equity funds in January, the most ever for any month on record.
Of course, the big reason average investors are finally warming up to stocks again is: "They've been missing the boat".
Signaling a Top?
Last week the Dow closed above 14,000 for the first time since the financial crisis hobbled the global economy. Small investors - having missed out on the last 7,500 points - don't want to miss any more. Some analysts say the return of the small investor is a signal that the bull market, already nearly four years old, may soon give up the ghost.
Mutual fund flows also just turned heavily toward equities. Does that mean the end is near? History shows that small investors are only a good indicator at market extremes. They tend to be wildly optimistic at market tops and wholly pessimistic at market bottoms.
-------------------------------------------------------------------------------------------------------------------------------------------
II. JACK'S WRAP, Friday, February 08, 2013
Jack Steiman is author of SwingTradeOnline
www.SwingTradeOnline.com
The market continues to perform well overall, but as I have been saying for a while now, there is more and more risk. Just take a look at the weekly RSI's (Relative Strength Index) on the major index charts. While the Nasdaq is low in the lower 60's due its lagging mostly from Apple Inc. (AAPL), most of the other major index charts are just below 70, or actually at 70. When weekly charts get to 70 on those RSI's, it's not great news for the bulls. This does not mean the market will imminently fall hard, but you know it's not too far away. It's definitely out there.
If you look at markets historically, when the weekly RSI's get to 70 on the major index charts, it's prone to selling. The weekly charts are powerful, so, at least, take the time to notice what's happening with sentiment on these charts and play appropriately. Now, even though there are red flags, this doesn't mean you run for shelter automatically and sell everything on the long side. There are some great stock set-ups, and yes, it's harder to get them to do what we'd like as fast as we'd like, but many stocks are performing well and set up to do so in the weeks ahead, overbought weekly charts or not.
|


