Friday, October 26 2012
The market has fallen to another critical level.
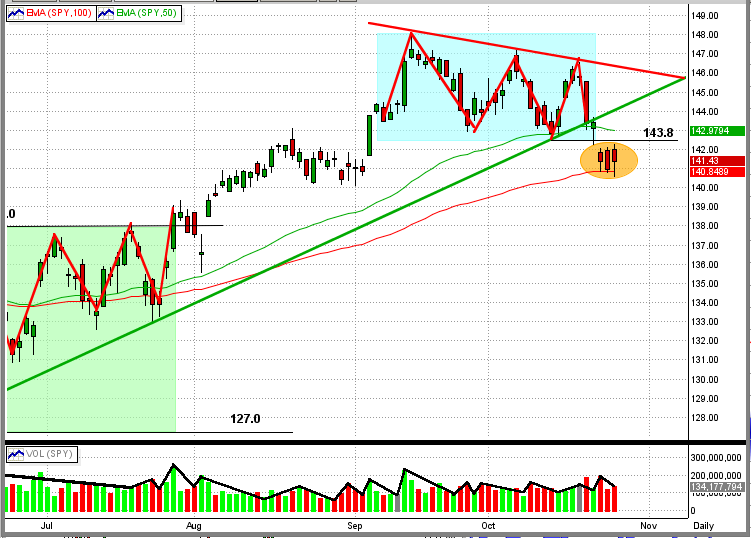
After falling about 4% in four trading days, the SPY has spent the last three days traveling along the "100-day EMA road" for the last three days (see Graph #1 immediately below). This is a critical point in the market because:
1) to get there, the SPY had to break resistance at $143.8 and 142.0 (i.e., the revered 1420 in the S&P 500).
2) the SPY is right on the very top of its 100-day EMA (red line),
3) we have seen bad 3rd quarter profit/outlook from some of the most stable companies in the counrty,
4) with bad profit and outlook numbers from tech leaders (Amazon, Apple, etc) after hours on Thursday, the
futures are down so we can expect a lower opening on Friday,
5) with any more bad economic/earnings data in the US, or bad news from Europe or China, this downdraft
could pick up steam quickly, and
6) these are very turbulent times and conditions/sentiment can change quickly.
All of the MIPS models (except the very low frequency MIPS1/VLF model) are short at this time. To get a better feeling of how MIPS "sees" the strength (or weakness) of this market, take a look at Graph #2 below.
Graph #1

Graph #2
This graph shows the MIPS Strength Indicator (MSI) for the SPY. The MSI is a measure of the "strengh" of the market
trend as determined by the leading indicators in our MIPS models. You can see this graph about 1/3 down on the homepage of our website. The MSI graph is updated on our website at least once a week. CAUTION: The MSI is a measure of the strength of the market, but is NOT to be seen as or used as a "signal" indicator !!!

Monday, October 15 2012
It looks like we dodged a bullet today. From our last look at the SPY price/volume chart in our previous email, it looked as though we could be about to experience a serious downdraft. But, MIPS kept us LONG, and we are glad it did.
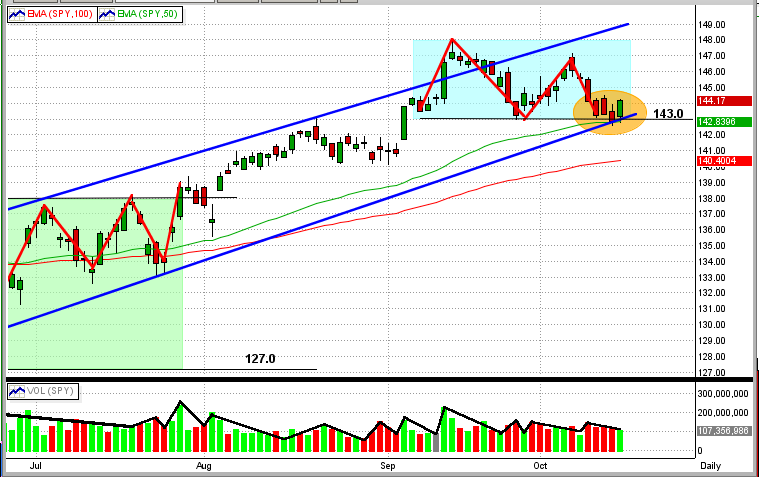
Today, the SPY hit a very critical downside price point and bounced back to the upside (see graph below).
At a price of $143 per share (black line), the SPY encountered the following resistance levels:
1) the 50-day EMA (green line),
2) the intermediate term trendline (blue line), and
3) the bottom of its six weeks trading range (cyan box).
Needless to say, it did not breach any of these resistance levels (which should prove to be very positive).

|