Monday, March 30 2015
Press ? for keyboard shortcuts.
The only good news that I could muster out of the last 2-3 weeks of "market noise" was that:
1) the Fed is still "dovish" with regard to raising interest rates,
2) the Fed still "rules",
3) relatively low volume says that it was not the Fat Kats causing last week's minor sell-off,
4) the SPY closed up above its 100-day EMA in the last two "attacks", and
5) this sideways trading pattern is getting "long in the tooth".
From this, one could expect a market bounce-back going forward, if not an SPY run-up to above $209. But, of course, it's anybody's guess from here, so let's simply follow MIPS' advice. Stay tuned !!!
BTW, these "sideways trading patterns" do not last forever. Many times, they break out in the same direction that they went in (up, in this case). And, the longer the time in a sideways pattern, the bigger the market move after the breakout.
ress ? for keyboard shortcuts.
In mid-February, the market (the SPY) broke out of its sideways trading pattern ("No-Man's-Land") and headed to what one might have thought was a new uptrend. As always, however, the market had its own view on what it was going to do, and it does as it wants. As we all know, starting on March 1st, the market stalled and waffled for a few days.
Then, the SPY got slapped back into No-Man's-Land, with a big drop on 3/06/2015. Ironically, the catalyst for this big drop was "too good" economic news, after a surprisingly good new jobs report and shrinking unemployment. Of course, good economic news should be good for the market, and it ultimately will be. But, this was mitigated away by "fear" of the Fed raising interest rates in June or September, which "overcame" the good economic news because it "MIGHT" affect the Fed's actions months from now. From my experience, these "knee-jerk" reactions to what might happen bad in the future that could trump positive results that have already happened, usually fizzles out within a few days. And this is exactly what happened today (3/12/15). I must add that today's positive move was also aided by the "cooling off" of recent gains in the value in the dollar.
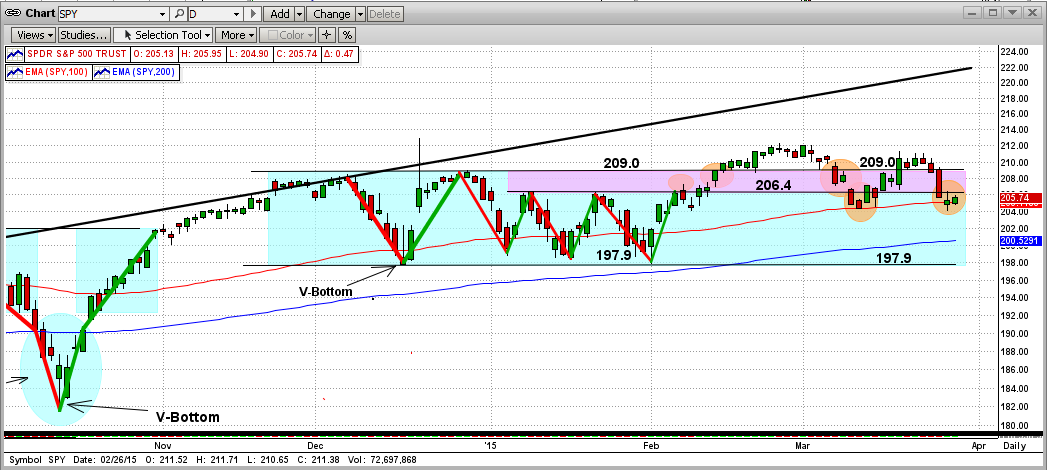
In the graph below (right-most orange circle), you will see that the SPY "held its ground" and bounced off of its 200-day EMA at $204.4 on 3/11/15; and then it climbed all the way back above its 50-day EMA to close at $207.1 today (3/12/15). I personally believe the market will go up from here, at least to again test the upside resistance at $209 on the SPY. What happens after that is anybody's guess, but MIPS will be watching closely for us. Stay tuned...
Sunday, March 15 2015
C O N F ID E N T I A L
From Paul D.
- this is simply my opinion/observation and it has nothing to do with our MIPS models...
Expect a market crash before August 2015 !!!
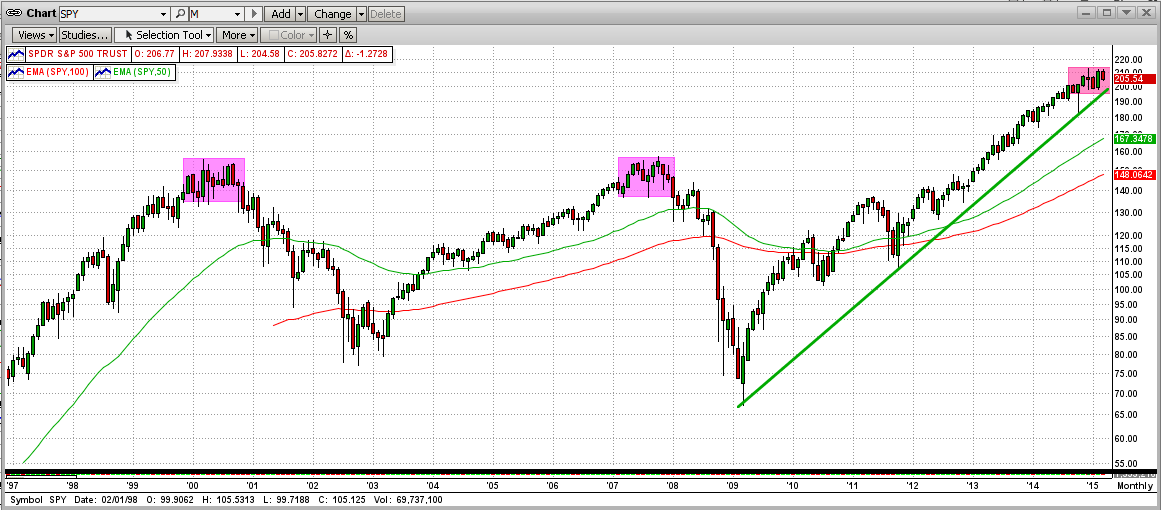
In the graph below, you will see that it took 10-12 months of sideways trading for the market (the SPY) to "top out" in both 1999-2000 and in 2007-2008.
My opinion is that this is roughly how long it takes for the big guys (Goldman Sachs, Morgan Stanley, UBS, etc.) to liquidate the holdings that they want to dump at the top (call me and I will explain this). For example, it would take months for a big guy to sell 100 million shares each of GE and Walmart and Merck, etc., without driving their prices through the floor. And, at the top, they hold 1,000's of positions just like that.
In the graph below, you can see that in 2014-2015 the market has basically traded sideways for 6 full months through February 2015, or 7 months counting March 2015. So, after 7 months in this sideways trading pattern, if the market stays in this relatively flat range for a few more months (highly likely), I believe that a Big Crash will come in July or August 2015 (most likely July 2015). If not, we could see the S&P 500 at $2500 or higher before the big crash finally comes.
This definitely does not mean that the MIPS models see the market the same way that I do (thankfully), so let's be patient while the market makes up its mind and MIPS follows it. Stay tuned ...
Thursday, March 12 2015
In mid-February, the market (the SPY) broke out of its sideways trading pattern ("No-Man's-Land") and headed to what one might have thought was a new uptrend. As always, however, the market had its own view on what it was going to do, and it does as it wants. As we all know, starting on March 1st, the market stalled and waffled for a few days.
Then, the SPY got slapped back into No-Man's-Land, with a big drop on 3/06/2015. Ironically, the catalyst for this big drop was "too good" economic news, after a surprisingly good new jobs report and shrinking unemployment. Of course, good economic news should be good for the market, and it ultimately will be. But, this was mitigated away by "fear" of the Fed raising interest rates in June or September, which "overcame" the good economic news because it "MIGHT" affect the Fed's actions months from now. From my experience, these "knee-jerk" reactions to what might happen bad in the future that could trump positive results that have already happened, usually fizzles out within a few days. And this is exactly what happened today (3/12/15). I must add that today's positive move was also aided by the "cooling off" of recent gains in the value in the dollar.
In the graph below (right-most orange circle), you will see that the SPY "held its ground" and bounced off of its 200-day EMA at $204.4 on 3/11/15; and then it climbed all the way back above its 50-day EMA to close at $207.1 today (3/12/15). I personally believe the market will go up from here, at least to again test the upside resistance at $209 on the SPY. What happens after that is anybody's guess, but MIPS will be watching closely for us. Stay tuned...
Hope this helps !!!
<<< Previous Blog >>>
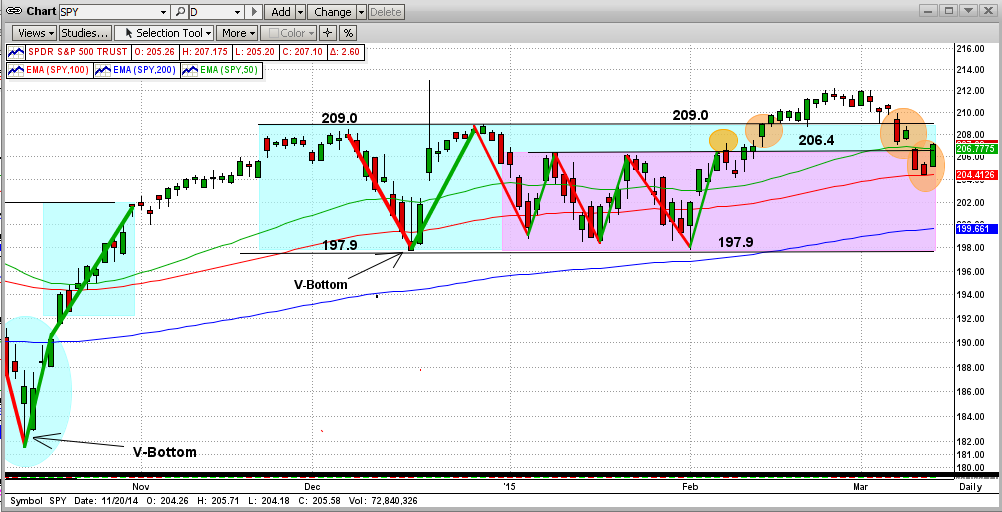
From the graph immediately below at today's close, you will see that the advancing forces (the Bulls) made their way up across the battlefield (pink space) from 197.9 to the beginning of No-Man's-Land at 206.4, with little or no resistance.
Then, they carried on through the "moat" around the castle (blue space) in No-Man's-Land in short order, with few set-backs. But, the Bears "stalled" them at the castle wall today, right at the 209.0 level (see the right-most orange circle in the graph). BTW, the 209.0 resistance level is the SPY's all-time-high, and hence, could provide ultra-resistance.
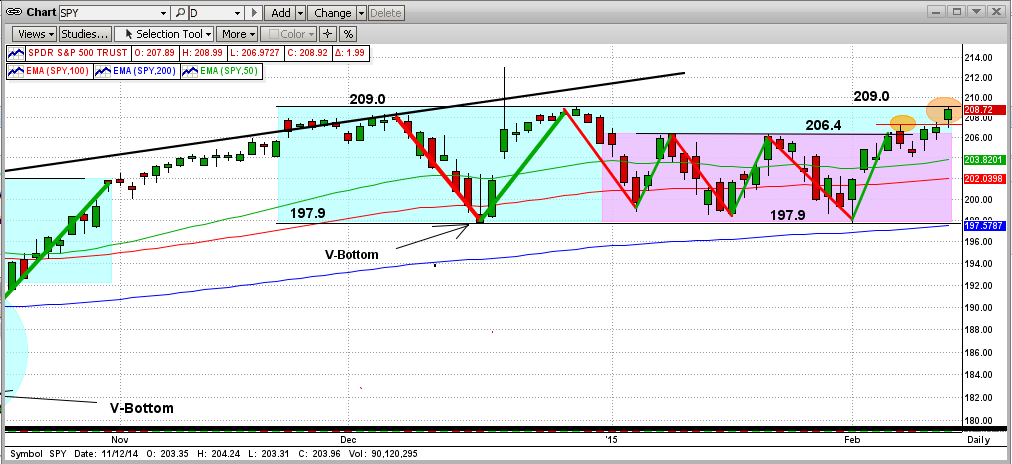
The last time the market charged the castle's wall, the upside resistance was at 189.0 (2nd graph below). it took nine charges to break out of No-Man's-Land, and it did so to the upside.
In order for the Bulls to feel comfortable now, any break to the upside from here needs to be dramatic. Otherwise, we may experience a Bear provided trip back down to 197.9, or lower (no free ride).
Let's keep watching, but let's wait for MIPS to tell us what to do next !!!
- Stay tuned...
|