Sunday, March 25 2018
There are many trading models/strategies that are categorized as being in the High Frequency Trading domain.
However, that definition has greatly different meanings depending upon what type of investor it is referring to.
A simplified broad range of “investors” is something like that below:
- Individual Investors like us (10-80 trades/year)
- Day Traders (4-5 trades/day)
- Machine Trading (1000’s of trades/day)
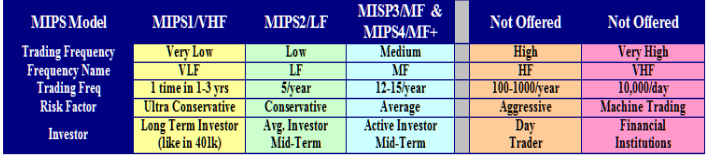
Over 90% of day traders lose money and machine trading is out of our reach. So, for the purpose of this blog,
let’s concentrate on individual investors.
In the category of “Individual Investors” there is at least three different kind of investors
1) buy-and-hold investors,
2) investors somewhat like buy-and-hold investors that use timing models to tell them when to buy/sell, and
3) Investors somewhat like day traders that believe that timing models that trade more often produce better
results.
.
The purpose of the blog is to show our MIPS members the FLAW in category #3 above. There are certainly
times when the market moves from up-to-down, and then from down-to-up in such a fashion that good timing
models can track the market successfully, and there are times when this is not the case.
Bad timing models chase every single dip in the market no matter how small, and regardless of whether or not
the market has actually changed direction (new trend). Good timing models (like MIPS) are extensive enough
to judge if the dip is “sufficient enough” for investors to change their position (long, short, cash) and/or if the main
trend has changed direction. And, good timing models have mathematical models built in that can ascertain the
“relatively” of the dip compared to the recent past. For example, with a good timing model, a 3% dip may issue a
signal change in a market that has been flat or in very low growth, whereas it may take an 8-9% drop for the
model to issue a signal change in a market that has grown 20-25% in the last 6-12 months. Models that are not
good enough to determine the above can trade 60-100 times per year with pathetic performance (mainly because
they trade on almost every single dip with no additional analysis).
Below is an example of a market that should not require an average of over 10-15 trades/year in the period of 2009-18.
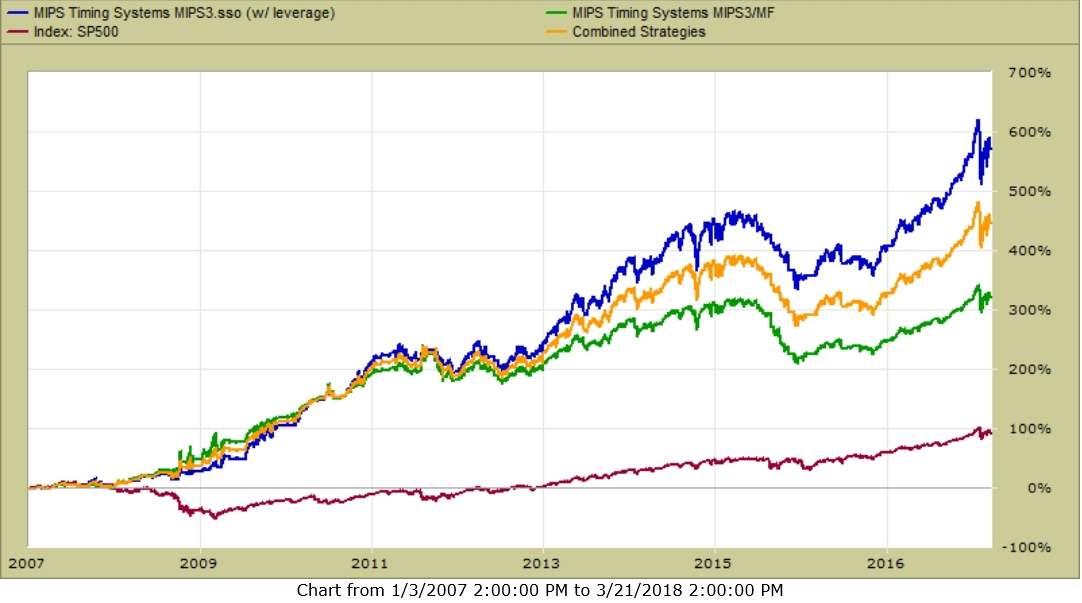
The graph below shows the MIPS3 model performance 2007-03/21/2018
- the performance definitely defines MIPS3 as a “good model”
MIPS3 trading SPY Long/Short
- Blue Line -- 1.50x Long / Long Only
- Orange Line – 1.25x Long / 0.5x Short
- Green Line – 1.00x Long / 1.0x Short
TRADING FREQUENCIES
The charts and graphs below are from TimerTrac.com. Our objective is to analyze the relationship between trading
frequencies of the 20+ best timing models on TimerTrac.com versus their 2-year and 10-year performances. This
certainly teaches us a lesson, but is not a very comprehensive study for professionals.
ELEVEN YEAR PERFORMANCE (2007-2017)
- The MIPS3 model issued 129 trades in this period (average of 12 trades/year)
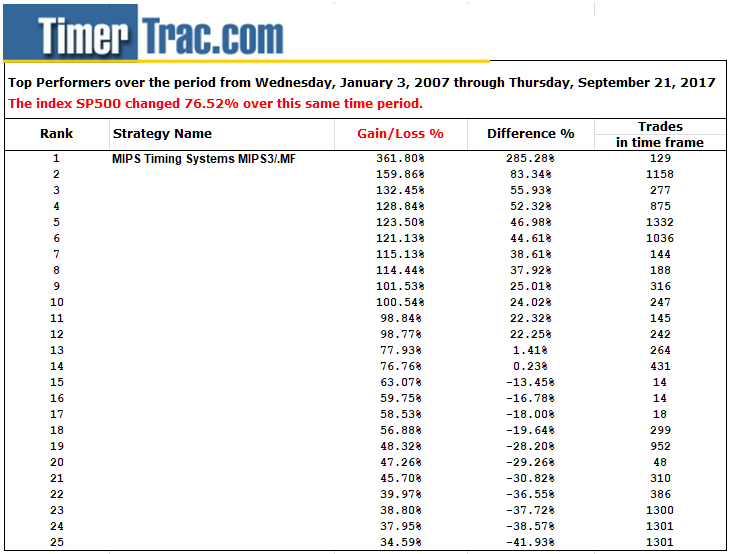
Performance
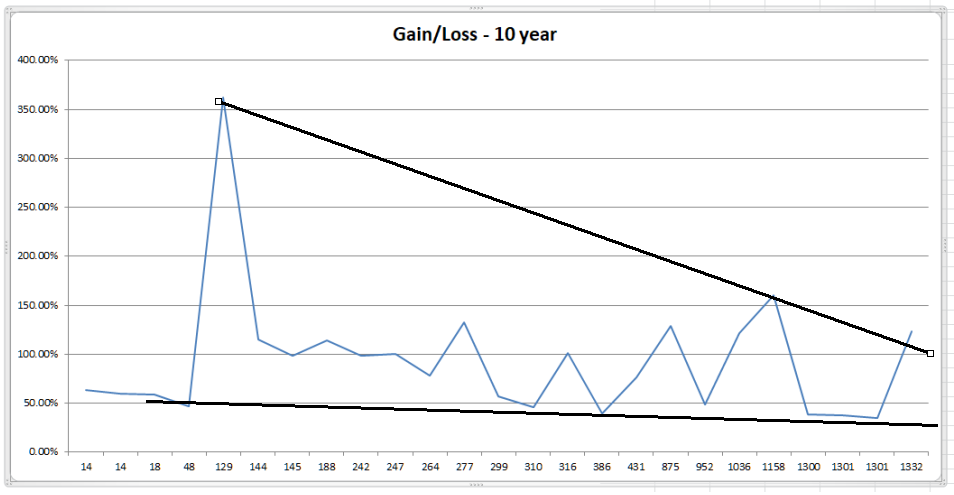
Number of Trades issued between 2007-2017
-----------------------------------------------------------------------------------------------------------------------------
TWO YEAR STUDY (2017-2018)
- The MIPS4 model issued 9 trades in this period (avg. 5 trades/year)
|
Top Performers over the period from January 3, 2016 through September, 2017
|
|
|
The index SP500 changed 34.75% over this same time period.
|
|
|
|
|
|
|
|
|
|
Ranking
|
|
Strategy Name
|
Gain/Loss %
|
Difference %
|
Trades
|
|
1
|
|
|
34.74%
|
0.00%
|
0
|
|
2
|
|
|
33.42%
|
-1.32%
|
13
|
|
3
|
|
|
32.94%
|
-1.80%
|
77
|
|
4
|
|
MIPS Timing Systems MIPS4/MF+
|
29.61%
|
-5.14%
|
9
|
|
5
|
|
MIPS Timing Systems MIPS3/MF
|
29.57%
|
-5.18%
|
7
|
|
8
|
|
|
29.49%
|
-5.25%
|
13
|
|
9
|
|
|
27.68%
|
-7.06%
|
144
|
|
10
|
|
|
26.85%
|
-7.89%
|
2
|
|
11
|
|
|
26.71%
|
-8.04%
|
10
|
|
12
|
|
MIPS Timing Systems MIPS2/LF
|
26.45%
|
-8.30%
|
10
|
|
13
|
|
|
26.13%
|
-8.61%
|
184
|
|
14
|
|
|
25.86%
|
-8.88%
|
19
|
|
15
|
|
|
25.39%
|
-9.35%
|
12
|
|
16
|
|
|
25.30%
|
-9.44%
|
88
|
|
17
|
|
|
25.18%
|
-9.56%
|
47
|
|
18
|
|
|
24.90%
|
-9.85%
|
169
|
|
19
|
|
|
24.23%
|
-10.51%
|
1
|
|
20
|
|
|
24.03%
|
-10.71%
|
124
|
|
21
|
|
|
22.10%
|
-12.65%
|
123
|
|
22
|
|
|
22.07%
|
-12.68%
|
29
|
|
23
|
|
|
21.97%
|
-12.78%
|
130
|
|
24
|
|
|
20.81%
|
-13.94%
|
44
|
|
25
|
|
|
19.73%
|
-15.02%
|
193
|
|
26
|
|
|
18.54%
|
-16.20%
|
38
|
|
27
|
|
|
18.27%
|
-16.48%
|
17
|
|
28
|
|
|
17.81%
|
-16.94%
|
81
|
|
29
|
|
|
16.70%
|
-18.04%
|
120
|
|
30
|
|
|
16.68%
|
-18.06%
|
52
|
|
31
|
|
|
15.31%
|
-19.44%
|
4
|
|
32
|
|
|
14.62%
|
-20.13%
|
67
|
|
33
|
|
|
13.76%
|
-20.98%
|
25
|
|
35
|
|
|
12.67%
|
-22.08%
|
29
|
|
36
|
|
|
12.65%
|
-22.10%
|
310
|
|
37
|
|
|
12.47%
|
-22.28%
|
302
|
|
38
|
|
|
12.45%
|
-22.29%
|
7
|
|
39
|
|
|
11.91%
|
-22.83%
|
302
|
|
39
|
|
|
11.91%
|
-22.83%
|
302
|
|
40
|
|
|
11.47%
|
-23.28%
|
22
|
|
41
|
|
|
11.21%
|
-23.53%
|
20
|
|
43
|
|
|
9.49%
|
-25.26%
|
5
|
|
42
|
|
|
9.49%
|
-25.25%
|
23
|
|
44
|
|
|
9.21%
|
-25.54%
|
72
|
|
44
|
|
|
9.21%
|
-25.54%
|
72
|
|
44
|
|
|
9.21%
|
-25.54%
|
72
|
|
44
|
|
|
9.21%
|
-25.54%
|
72
|
|
44
|
|
|
9.21%
|
-25.54%
|
72
|
|
44
|
|
|
9.21%
|
-25.54%
|
72
|
|
45
|
|
|
8.96%
|
-25.78%
|
5
|
|
46
|
|
|
8.28%
|
-26.47%
|
14
|
|
47
|
|
|
7.40%
|
-27.34%
|
6
|
|
48
|
|
|
7.20%
|
-27.54%
|
5
|
|
49
|
|
|
6.03%
|
-28.71%
|
6
|
|
50
|
|
|
5.46%
|
-29.28%
|
134
|
|
51
|
|
|
4.99%
|
-29.76%
|
21
|
|
52
|
|
|
3.67%
|
-31.08%
|
5
|
|
52
|
|
|
3.67%
|
-31.08%
|
5
|
|
52
|
|
|
3.67%
|
-31.08%
|
5
|
|
53
|
|
|
3.59%
|
-31.16%
|
41
|
|
54
|
|
|
3.40%
|
-31.35%
|
253
|
|
55
|
|
|
2.36%
|
-32.38%
|
523
|
|
56
|
|
|
0.42%
|
-34.32%
|
535
|
|
57
|
|
|
0.18%
|
-34.56%
|
61
|
|
58
|
|
|
0.02%
|
-34.72%
|
39
|
|
59
|
|
|
0.00%
|
-34.74%
|
0
|
|
59
|
|
|
0.00%
|
-34.74%
|
0
|
|
60
|
|
|
-3.16%
|
-37.90%
|
55
|
|
61
|
|
|
-4.15%
|
-38.89%
|
121
|
|
62
|
|
|
-4.86%
|
-39.60%
|
213
|
|
63
|
|
|
-4.88%
|
-39.62%
|
213
|
|
64
|
|
|
-6.10%
|
-40.84%
|
114
|
|
65
|
|
|
-6.12%
|
-40.86%
|
2
|
|
66
|
|
|
-7.52%
|
-42.26%
|
43
|
|
67
|
|
|
-17.57%
|
-52.32%
|
93
|
|
68
|
|
|
-19.62%
|
-54.36%
|
248
|
|
69
|
|
|
-20.90%
|
-55.64%
|
267
|
Performance
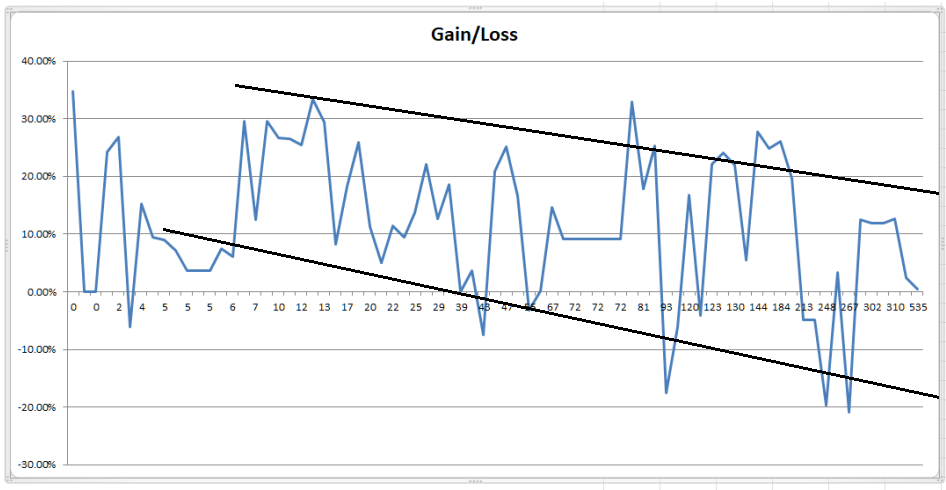
Number of Trades Issues in 2016 - 2017
---------------------------------------------------------------------------------------------------------------------------
The above shows that more frequent trading does not automatically produce better results. Most individual timing models
that trade frequently do not have ample time to sell and buy back in short time periods end up getting whipsawed. For
example, a model that trades an average of 50 times/year, has an average “signal life” of just 5 trading days (where “signal life”
is the average time any given signal is in effect). This means that the model would have to decide when to buy and when
to sell in just 5 trading days over-and over, all year long without getting whipsawed often. This is damn near impossible
using data from daily bars (1 data point/day), instead of say like hourly bars (for roughly 8 data points/day). MIPS fixed
this in its “Blaster Series” models, released in 1Q’16.
So, you should pick a timing model with a good, long-term verified track record, and follow it. If you can’t simply
do that, start with say 3 models and migrate to the model that does the best over time. If everyone does this,
then it’s a good chance that all may end up following the MIPS models
Paul Distefano, PhD
MIPS Timing Systems, LLC
Houston, TX
281-251-MIPS(6477)
Saturday, March 17 2018
Week before last, the QQQ broke out to the upside and formed a new all-time high. The main
question then, of course, was "where does it go from here" ?
My answer then was:
"I expect the QQQ to climb higher, drop back to "test" this all-time high support level, and then
continue higher in 2018."
The first part of this was completed this week when the QQQ dropped back to test its support level at
around $171 for four straight days (see graph below). As you can see, the current support level held
steadfast at almost exactly $171 on each day.
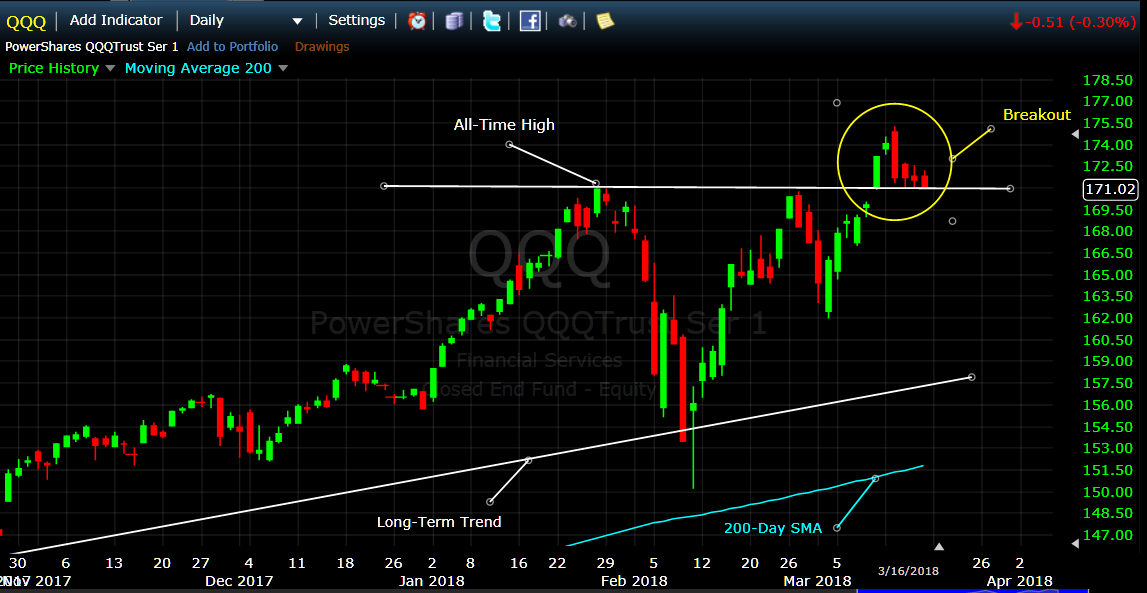
From here, the QQQ could hold its support level and head back up for months; or of course, it could
break its all-time high support level to the downside and head back to test its previous support level at
around $150. My bet would be on the 1st option above, but I am no MIPS.
{BTW - In my opinion, the SPY will follow the same path as the QQQ.}
As far as which position we should be in going forward (long, short, cash), we need to rely on MIPS to
answer that.
Good trading...
Paul Distefano, PhD
CEO / Founder
MIPS Timing Systems, LLC
Houston, TX
281-251-MIPS(6477)
===============================================================
<<< Previous Blog >>>
03/12/2018
MIPS Members:
In our previous blog below, we pointed out that the SPY had broken out of its "triangle" pattern to the
upside, and that the Nasdaq 100 (QQQ) had climbed about 65% of the way back to its all-time high.
Since then, the QQQ has completed a "V-Bottom" pattern and has broken out above its all-time high
(see graph below).
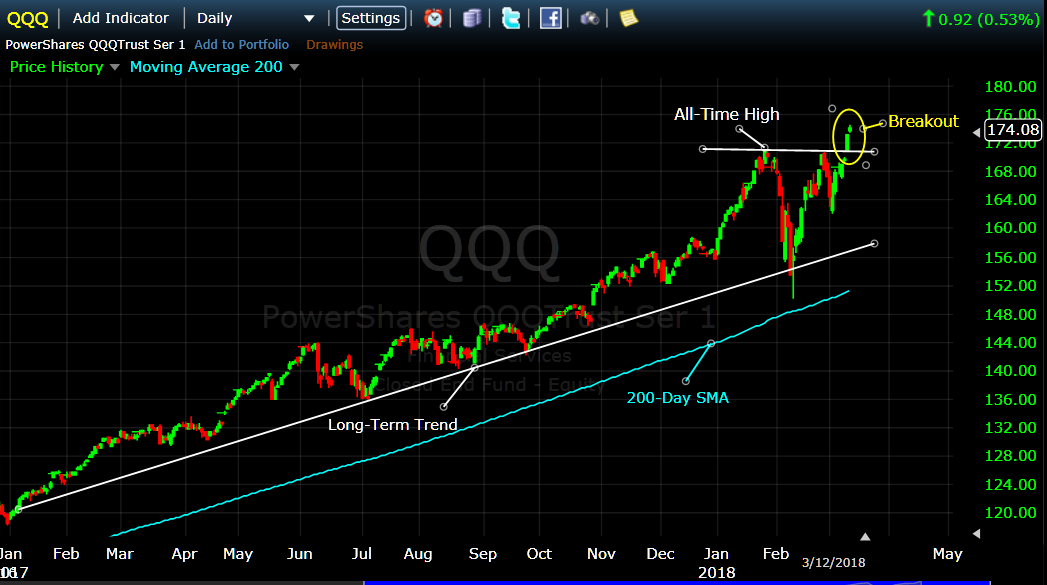
From here, I expect the QQQ to climb higher, drop back to "test" this all-time high support level, and then
continue higher in 2018. Of course, this "climb" will be challenged by real dips, fake drops, volatility,
etc. Top management from many well-respected advisory firms see a strong possibility for this bull market
to thrive for another 2-3 years.
The challenge, of course, is to know when to get out of the market (or go short) WITHOUT chasing every
little fake dip and ending up getting whipsawed (nothing worse). The algorithms built into the Blaster
Series version of MIPS were designed to avoid getting suckered into trading every dip and ending up losing
a lot of your hard earned money. After much research, and through inputs from our MIPS family, we
have not seen nor been told about any other model on the market today that can beat MIPS in that game.
This is a time when we can either have a few more years with 20%+ gains, or a time when we give back
most or all of our gains from the last 8-10 years. Please don't "go it alone". Either use MIPS or find
another good quantitative model that did well in the market crash of 2008, and since then.
Good trading...
Paul Distefano, PhD
CEO / Founder
MIPS Timing Systems, LLC
Houston, TX
281-251-MIPS(6477)
Monday, March 12 2018
In our previous blog below, we pointed out that the SPY had broken out of its "triangle" pattern to the
upside, and that the Nasdaq 100 (QQQ) had climbed about 65% of the way back to its all-time high.
Since then, the QQQ has completed a "V-Bottom" pattern and has broken out above its all-time high
(see graph below).
From here, I expect the QQQ to climb higher, drop back to "test" this all-time high support level, and then
continue higher in 2018. Of course, this "climb" will be challenged by real dips, fake drops, volatility,
etc. Top management from many well-respected advisory firms see a strong possibility for this bull market
to thrive for another 2-3 years.
The challenge, of course, is to know when to get out of the market (or go short) WITHOUT chasing every
little fake dip and ending up getting whipsawed (nothing worse). The algorithms built into the Blaster
Series version of MIPS were designed to avoid getting suckered into trading every dip and ending up losing
a lot of your hard earned money. After much research, and through inputs from our MIPS family, we
have not seen nor been told about any other model on the market today that can beat MIPS in that game.
This is a time when we can either have a few more years with 20%+ gains, or a time when we give back
most or all of our gains from the last 8-10 years. Please don't "go it alone". Either use MIPS or find
another good quantitative model that did well in the market crash of 2008, and since then.
Good trading...
Paul Distefano, PhD
CEO / Founder
MIPS Timing Systems, LLC
Houston, TX
281-251-MIPS(6477)
===========================================
<<< Previous MIPS Blog >>>
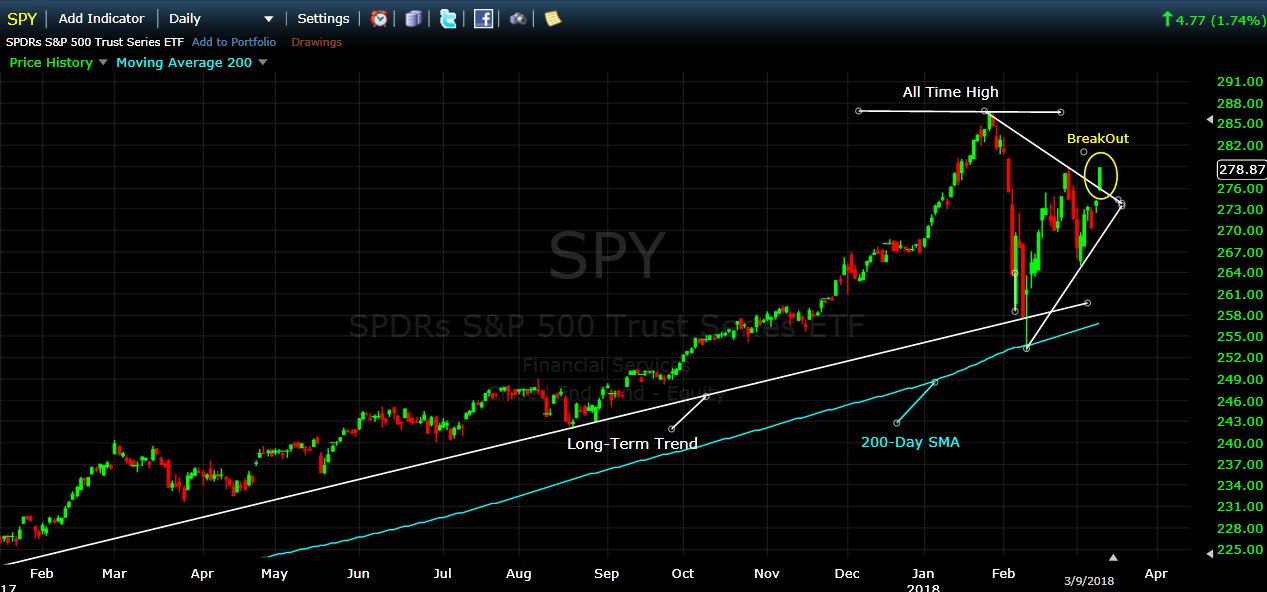
MIPS - Was Last Week's Market Move a Breakout ?
MIPS Members:
Of course, everyone wants to know if the most recent "correction" was the beginning of new "bear
market", or just a scare. Let me say that, to my knowledge, there has never been a real "bear market"
without the country being in on near a "recession".
I won't bore you with the details, but by all measures the economy is very strong (growth in the GDP,
more jobs, etc.). So strong, in fact, that investors were initially worried about inflation and rising interest
rates.
I personally believe that this all began after the market that had been climbing for the last year or so
started to soar at a much higher rate and put itself in a position of being highly overbought. Of course, the
fat kats that had ridden the market up did not want to give back a single dime, so they dumped from fear
of inflation and higher interest rates in this booming economy. Then, a few days later, the fat kats who
had driven the market down by about 9% started re-buying, and the little guys joined them with their
"buy on the dips" strategy.
When the market was heading back up quickly to form a near perfect "V-Bottom" pattern, the up-tick was
reversed on a very good jobs report, because investors were sucked in by the crap from the press
claiming that the low unemployment numbers would surely lead to inflation. Then, the crap was negated
by the fact that many new jobs were filled by a small percentage of the massive number of people that had
given up hope for a job and hence were in the "not looking for a job" space. In other words, the new jobs
had not only lowered the jobless rate, but they had INCREASED the "participation level". This means that
many of the new jobs went to some of the millions of people that had given up finding a job and had run
out of gov't unemployment benefits. If this is correct, the labor force is not close to being tight.
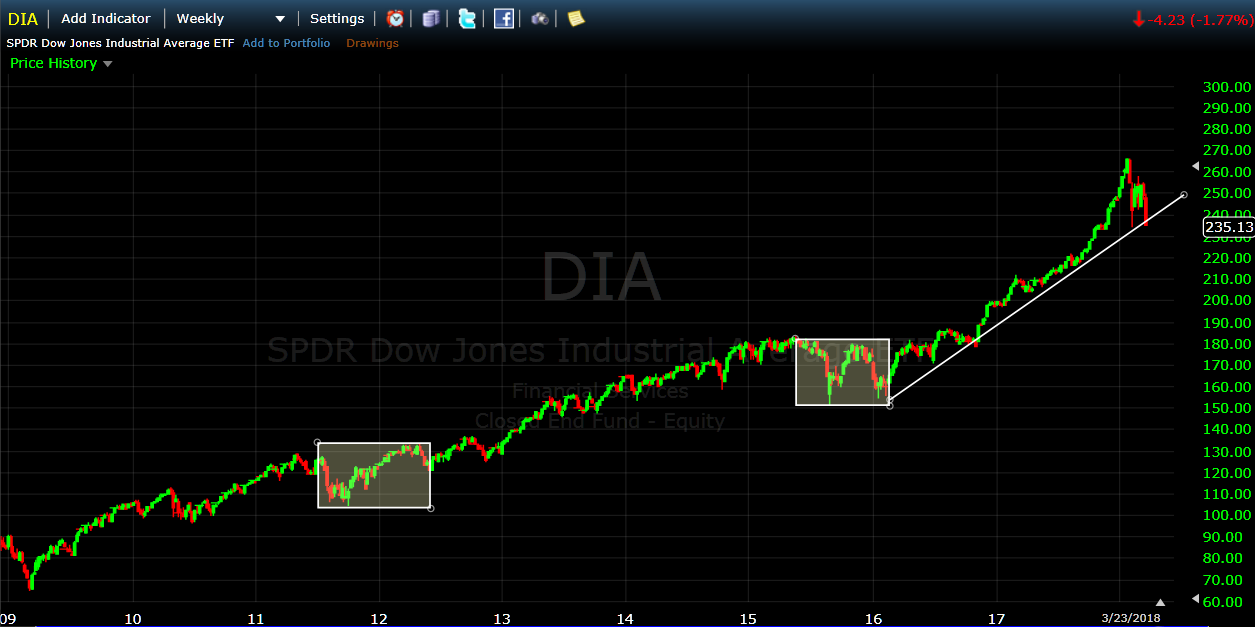
As a result of that above, the market seems to have broken out of the current "triangle pattern" seen in
the graph below.
Of course, this does not mean that the market will reach highs in the near future. I think it will, but I am
not MIPS. To be comfortable about when to go in and get out of the market, follow MIPS.
Paul Distefano, PhD
MIPS Timing Systems, LLC
Houston, TX
281-251-MIPS(6477)
Saturday, March 10 2018
Of course, everyone wants to know if the most recent "correction" was the beginning of new "bear
market", or just a scare. Let me say that, to my knowledge, there has never been a real "bear market"
without the country being in on near a "recession".
I won't bore you with the details, but by all measures the economy is very strong (growth in the GDP,
more jobs, etc.). So strong, in fact, that investors were initially worried about inflation and rising interest
rates.
I personally believe that this all began after the market that had been climbing for the last year or so
started to soar at a much higher rate and put itself in a position of being highly overbought. Of course, the
fat kats that had ridden the market up did not want to give back a single dime, so they dumped from fear
of inflation and higher interest rates in this booming economy. Then, a few days later, the fat kats who
had driven the market down by about 9% started re-buying, and the little guys joined them with their
"buy on the dips" strategy.
When the market was heading back up quickly to form a near perfect "V-Bottom" pattern, the up-tick was
reversed on a very good jobs report, because investors were sucked in by the crap from the press
claiming that the low unemployment numbers would surely lead to inflation. Then, the crap was negated
by the fact that many new jobs were filled by a small percentage of the massive number of people that had
given up hope for a job and hence were in the "not looking for a job" space. In other words, the new jobs
had not only lowered the jobless rate, but they had INCREASED the "participation level". This means that
many of the new jobs went to some of the millions of people that had given up finding a job and had run
out of gov't unemployment benefits. If this is correct, the labor force is not close to being tight.
As a result of that above, the market seems to have broken out of the current "triangle pattern" seen in
the graph below.
Of course, this does not mean that the market will reach highs in the near future. I think it will, but I am
not MIPS. To be comfortable about when to go in and get out of the market, follow MIPS.
Paul Distefano, PhD
MIPS Timing Systems, LLC
Houston, TX
281-251-MIPS(6477)
|


