There are many trading models/strategies that are categorized as being in the High Frequency Trading domain.
However, that definition has greatly different meanings depending upon what type of investor it is referring to.
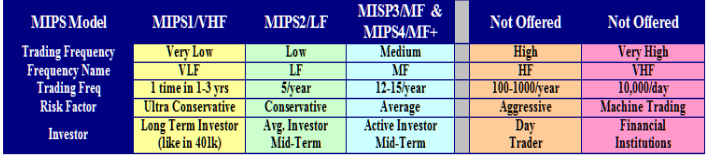
A simplified broad range of “investors” is something like that below:
- Individual Investors like us (10-80 trades/year)
- Day Traders (4-5 trades/day)
- Machine Trading (1000’s of trades/day)
Over 90% of day traders lose money and machine trading is out of our reach. So, for the purpose of this blog,
let’s concentrate on individual investors.
In the category of “Individual Investors” there is at least three different kind of investors
1) buy-and-hold investors,
2) investors somewhat like buy-and-hold investors that use timing models to tell them when to buy/sell, and
3) Investors somewhat like day traders that believe that timing models that trade more often produce better
results.
.
The purpose of the blog is to show our MIPS members the FLAW in category #3 above. There are certainly
times when the market moves from up-to-down, and then from down-to-up in such a fashion that good timing
models can track the market successfully, and there are times when this is not the case.
Bad timing models chase every single dip in the market no matter how small, and regardless of whether or not
the market has actually changed direction (new trend). Good timing models (like MIPS) are extensive enough
to judge if the dip is “sufficient enough” for investors to change their position (long, short, cash) and/or if the main
trend has changed direction. And, good timing models have mathematical models built in that can ascertain the
“relatively” of the dip compared to the recent past. For example, with a good timing model, a 3% dip may issue a
signal change in a market that has been flat or in very low growth, whereas it may take an 8-9% drop for the
model to issue a signal change in a market that has grown 20-25% in the last 6-12 months. Models that are not
good enough to determine the above can trade 60-100 times per year with pathetic performance (mainly because
they trade on almost every single dip with no additional analysis).
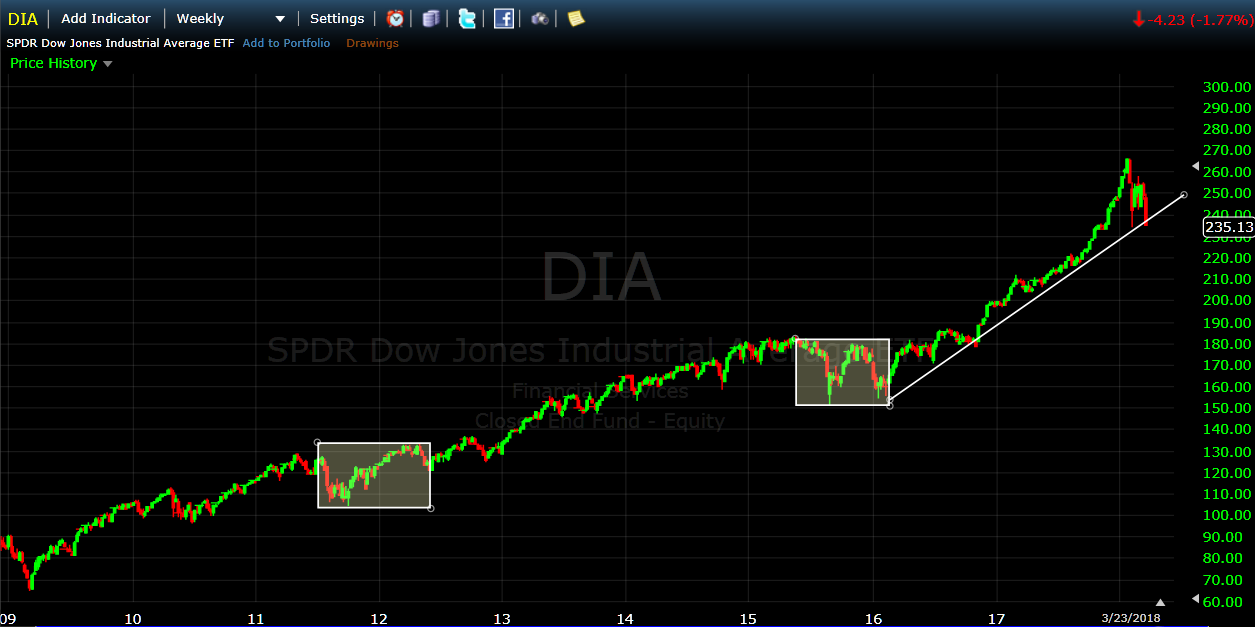
Below is an example of a market that should not require an average of over 10-15 trades/year in the period of 2009-18.
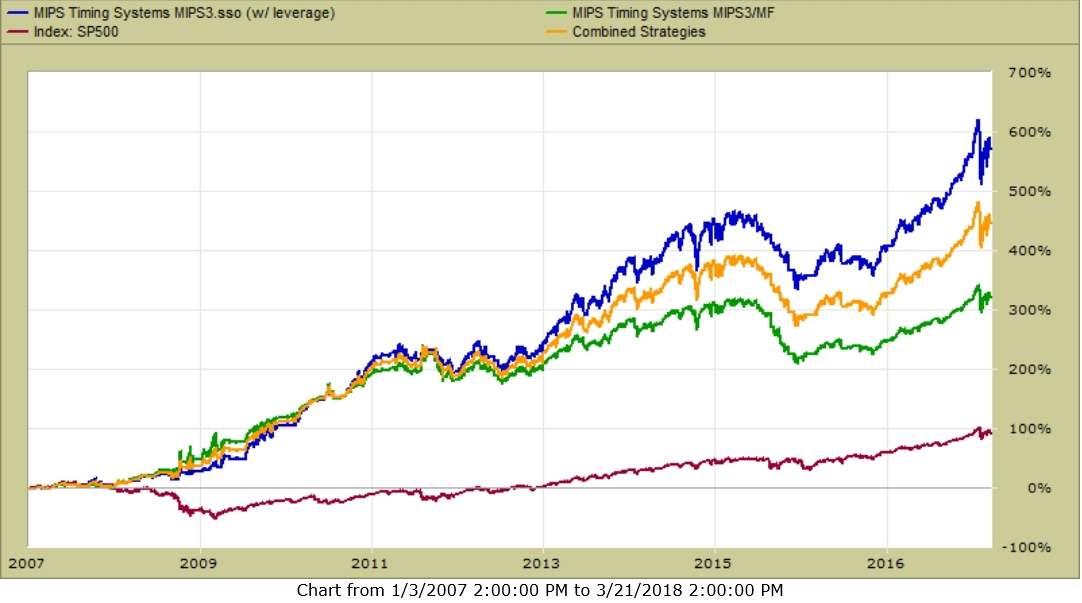
The graph below shows the MIPS3 model performance 2007-03/21/2018
- the performance definitely defines MIPS3 as a “good model”
MIPS3 trading SPY Long/Short
- Blue Line -- 1.50x Long / Long Only
- Orange Line – 1.25x Long / 0.5x Short
- Green Line – 1.00x Long / 1.0x Short
TRADING FREQUENCIES
The charts and graphs below are from TimerTrac.com. Our objective is to analyze the relationship between trading
frequencies of the 20+ best timing models on TimerTrac.com versus their 2-year and 10-year performances. This
certainly teaches us a lesson, but is not a very comprehensive study for professionals.
ELEVEN YEAR PERFORMANCE (2007-2017)
- The MIPS3 model issued 129 trades in this period (average of 12 trades/year)
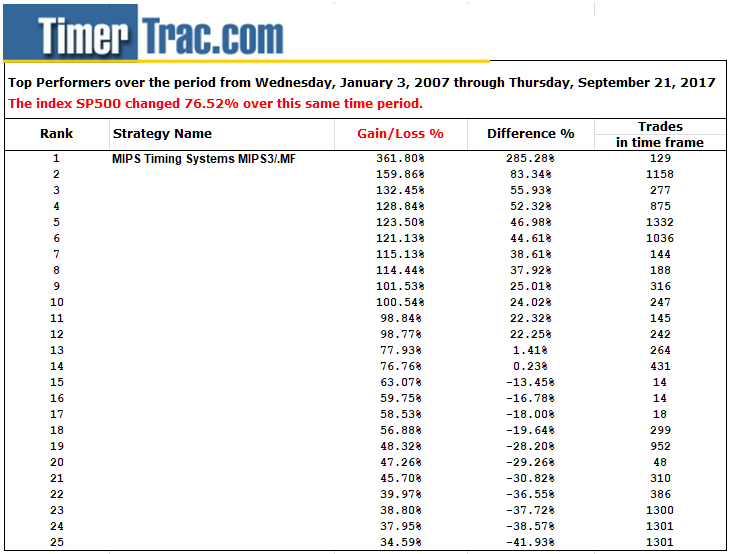
Performance
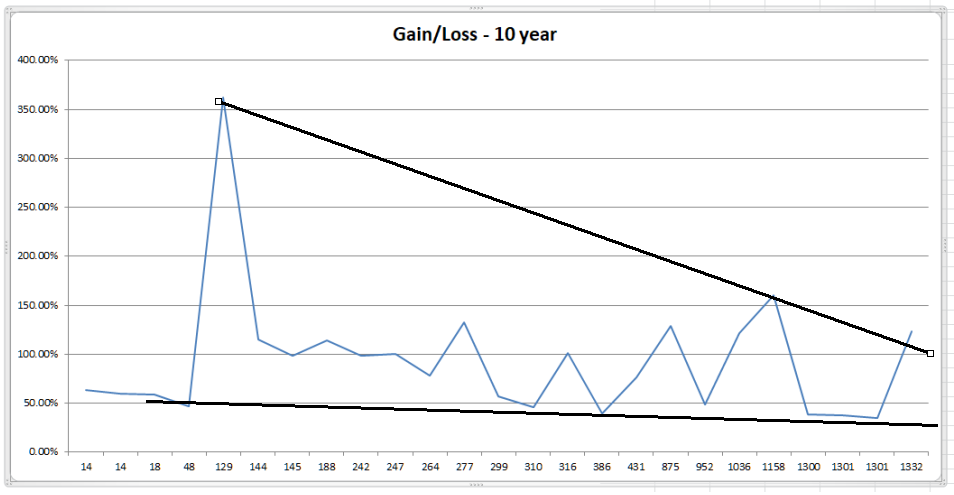
Number of Trades issued between 2007-2017
-----------------------------------------------------------------------------------------------------------------------------
TWO YEAR STUDY (2017-2018)
- The MIPS4 model issued 9 trades in this period (avg. 5 trades/year)
|
Top Performers over the period from January 3, 2016 through September, 2017
|
|
|
The index SP500 changed 34.75% over this same time period.
|
|
|
|
|
|
|
|
|
|
Ranking
|
|
Strategy Name
|
Gain/Loss %
|
Difference %
|
Trades
|
|
1
|
|
|
34.74%
|
0.00%
|
0
|
|
2
|
|
|
33.42%
|
-1.32%
|
13
|
|
3
|
|
|
32.94%
|
-1.80%
|
77
|
|
4
|
|
MIPS Timing Systems MIPS4/MF+
|
29.61%
|
-5.14%
|
9
|
|
5
|
|
MIPS Timing Systems MIPS3/MF
|
29.57%
|
-5.18%
|
7
|
|
8
|
|
|
29.49%
|
-5.25%
|
13
|
|
9
|
|
|
27.68%
|
-7.06%
|
144
|
|
10
|
|
|
26.85%
|
-7.89%
|
2
|
|
11
|
|
|
26.71%
|
-8.04%
|
10
|
|
12
|
|
MIPS Timing Systems MIPS2/LF
|
26.45%
|
-8.30%
|
10
|
|
13
|
|
|
26.13%
|
-8.61%
|
184
|
|
14
|
|
|
25.86%
|
-8.88%
|
19
|
|
15
|
|
|
25.39%
|
-9.35%
|
12
|
|
16
|
|
|
25.30%
|
-9.44%
|
88
|
|
17
|
|
|
25.18%
|
-9.56%
|
47
|
|
18
|
|
|
24.90%
|
-9.85%
|
169
|
|
19
|
|
|
24.23%
|
-10.51%
|
1
|
|
20
|
|
|
24.03%
|
-10.71%
|
124
|
|
21
|
|
|
22.10%
|
-12.65%
|
123
|
|
22
|
|
|
22.07%
|
-12.68%
|
29
|
|
23
|
|
|
21.97%
|
-12.78%
|
130
|
|
24
|
|
|
20.81%
|
-13.94%
|
44
|
|
25
|
|
|
19.73%
|
-15.02%
|
193
|
|
26
|
|
|
18.54%
|
-16.20%
|
38
|
|
27
|
|
|
18.27%
|
-16.48%
|
17
|
|
28
|
|
|
17.81%
|
-16.94%
|
81
|
|
29
|
|
|
16.70%
|
-18.04%
|
120
|
|
30
|
|
|
16.68%
|
-18.06%
|
52
|
|
31
|
|
|
15.31%
|
-19.44%
|
4
|
|
32
|
|
|
14.62%
|
-20.13%
|
67
|
|
33
|
|
|
13.76%
|
-20.98%
|
25
|
|
35
|
|
|
12.67%
|
-22.08%
|
29
|
|
36
|
|
|
12.65%
|
-22.10%
|
310
|
|
37
|
|
|
12.47%
|
-22.28%
|
302
|
|
38
|
|
|
12.45%
|
-22.29%
|
7
|
|
39
|
|
|
11.91%
|
-22.83%
|
302
|
|
39
|
|
|
11.91%
|
-22.83%
|
302
|
|
40
|
|
|
11.47%
|
-23.28%
|
22
|
|
41
|
|
|
11.21%
|
-23.53%
|
20
|
|
43
|
|
|
9.49%
|
-25.26%
|
5
|
|
42
|
|
|
9.49%
|
-25.25%
|
23
|
|
44
|
|
|
9.21%
|
-25.54%
|
72
|
|
44
|
|
|
9.21%
|
-25.54%
|
72
|
|
44
|
|
|
9.21%
|
-25.54%
|
72
|
|
44
|
|
|
9.21%
|
-25.54%
|
72
|
|
44
|
|
|
9.21%
|
-25.54%
|
72
|
|
44
|
|
|
9.21%
|
-25.54%
|
72
|
|
45
|
|
|
8.96%
|
-25.78%
|
5
|
|
46
|
|
|
8.28%
|
-26.47%
|
14
|
|
47
|
|
|
7.40%
|
-27.34%
|
6
|
|
48
|
|
|
7.20%
|
-27.54%
|
5
|
|
49
|
|
|
6.03%
|
-28.71%
|
6
|
|
50
|
|
|
5.46%
|
-29.28%
|
134
|
|
51
|
|
|
4.99%
|
-29.76%
|
21
|
|
52
|
|
|
3.67%
|
-31.08%
|
5
|
|
52
|
|
|
3.67%
|
-31.08%
|
5
|
|
52
|
|
|
3.67%
|
-31.08%
|
5
|
|
53
|
|
|
3.59%
|
-31.16%
|
41
|
|
54
|
|
|
3.40%
|
-31.35%
|
253
|
|
55
|
|
|
2.36%
|
-32.38%
|
523
|
|
56
|
|
|
0.42%
|
-34.32%
|
535
|
|
57
|
|
|
0.18%
|
-34.56%
|
61
|
|
58
|
|
|
0.02%
|
-34.72%
|
39
|
|
59
|
|
|
0.00%
|
-34.74%
|
0
|
|
59
|
|
|
0.00%
|
-34.74%
|
0
|
|
60
|
|
|
-3.16%
|
-37.90%
|
55
|
|
61
|
|
|
-4.15%
|
-38.89%
|
121
|
|
62
|
|
|
-4.86%
|
-39.60%
|
213
|
|
63
|
|
|
-4.88%
|
-39.62%
|
213
|
|
64
|
|
|
-6.10%
|
-40.84%
|
114
|
|
65
|
|
|
-6.12%
|
-40.86%
|
2
|
|
66
|
|
|
-7.52%
|
-42.26%
|
43
|
|
67
|
|
|
-17.57%
|
-52.32%
|
93
|
|
68
|
|
|
-19.62%
|
-54.36%
|
248
|
|
69
|
|
|
-20.90%
|
-55.64%
|
267
|
Performance
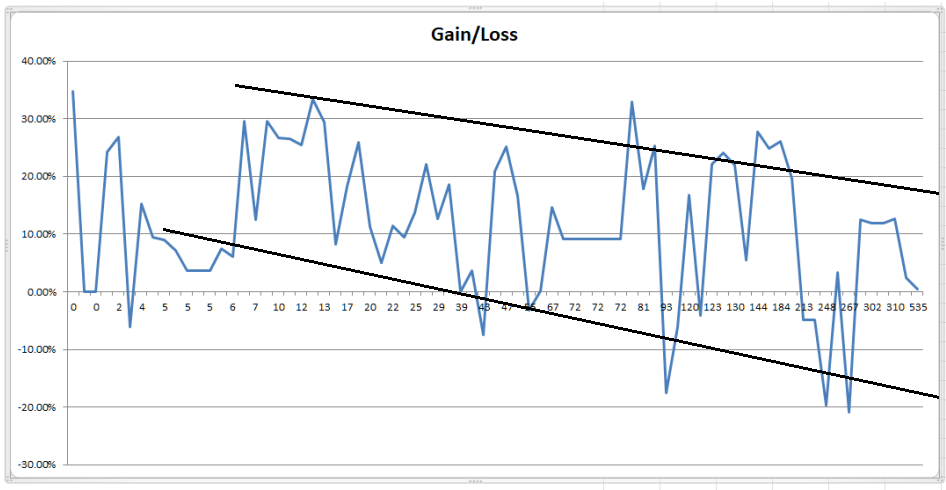
Number of Trades Issues in 2016 - 2017
---------------------------------------------------------------------------------------------------------------------------
The above shows that more frequent trading does not automatically produce better results. Most individual timing models
that trade frequently do not have ample time to sell and buy back in short time periods end up getting whipsawed. For
example, a model that trades an average of 50 times/year, has an average “signal life” of just 5 trading days (where “signal life”
is the average time any given signal is in effect). This means that the model would have to decide when to buy and when
to sell in just 5 trading days over-and over, all year long without getting whipsawed often. This is damn near impossible
using data from daily bars (1 data point/day), instead of say like hourly bars (for roughly 8 data points/day). MIPS fixed
this in its “Blaster Series” models, released in 1Q’16.
So, you should pick a timing model with a good, long-term verified track record, and follow it. If you can’t simply
do that, start with say 3 models and migrate to the model that does the best over time. If everyone does this,
then it’s a good chance that all may end up following the MIPS models
Paul Distefano, PhD
MIPS Timing Systems, LLC
Houston, TX
281-251-MIPS(6477)


