In a previous blog on April 8, 2103, we wrote about how the stock market is basically being controlled by (the actions of) one man - Ben Bernanke. This, of course, has everything to do with his printing more and more of your money, to the tune of $85 Billion every month (that's over $1 Trillion/year) !!! And, the Fed continues to do so. The point of the previous blog (and this one) was that it is very hard for the market to go down with this kind of money working to keep interest rates low. Remember the #1 rule in stock investing - "Don't fight the Fed." Of course, with low interest rates, money naturally funnels its way out of bonds and into stocks (and there is a lot of money in the bond market, like about 5 times that in the stock market).
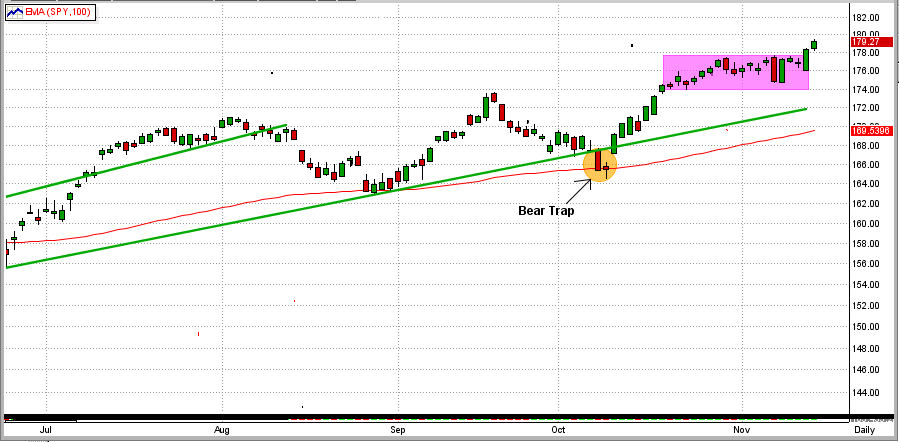
At any rate, after trading in a tight sideways pattern for over 3 weeks, the SPY broke to the upside yesterday (Wednesday) and again today. See graph blow.

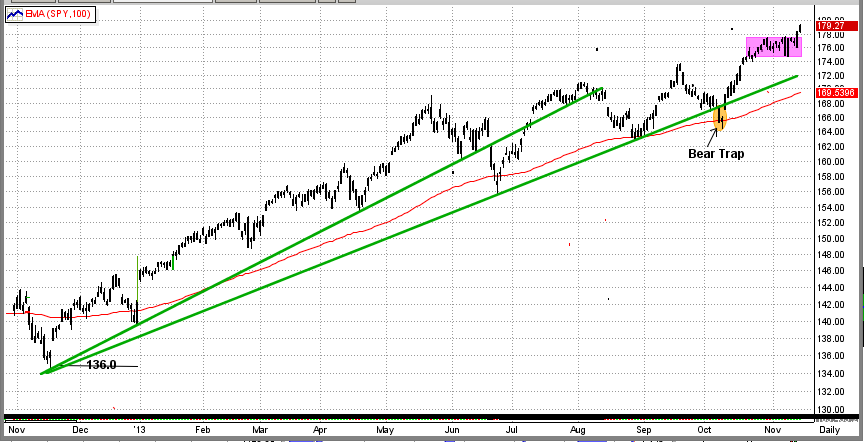
Also, as expected, the long-term upside trend continues from all the way back in November 2012 (see the long trend lines in the graph below). Again, this is no surprise with the Fed's extensive QE3 "program" (if you want to call it that). When (and if) this comes to an end, it most likely won't be pretty.
Of course, this long, relatively smooth up-trend is the reason that the MIPS models have not traded very often between late 2012 and thru Nov 14, 2013. We will wait for MIPS to tell us when the party is over.
