site map
my account
contact
our facebook page
home
  • Home
  • Market
  • MIPS 101
  • Services
  • Subscribe
  • Performance
  • M1234/Signals
  • Nitro/Signals
  • FAQs
  • Blogs
  • About Us
  • Contact
Latest Posts
  • Why Is the Last MIPS Long Signal (6/26/20) Still In Effect After 11 Months?
  • Exactly Where Is the Stock Market Going From Here?
  • Market Breakout?
  • You Must Participate in Your Own "Investment Risk"
  • MIPS Signals Since June 2020 (Summary)
Archive
  • May 2021 (1)
  • January 2021 (1)
  • December 2020 (1)
  • November 2020 (1)
  • October 2020 (2)
  • September 2020 (1)
  • August 2020 (3)
  • July 2020 (2)
  • June 2020 (1)
  • May 2020 (2)
  • April 2020 (6)
  • March 2020 (4)
  • February 2020 (3)
  • January 2020 (1)
  • November 2019 (1)
  • October 2019 (2)
  • September 2019 (2)
  • August 2019 (1)
  • July 2019 (1)
  • June 2019 (1)
  • May 2019 (1)
  • April 2019 (3)
  • March 2019 (4)
  • February 2019 (2)
  • January 2019 (4)
  • November 2018 (3)
  • October 2018 (1)
  • September 2018 (1)
  • August 2018 (2)
  • July 2018 (3)
  • June 2018 (1)
  • May 2018 (3)
  • April 2018 (4)
  • March 2018 (4)
  • February 2018 (4)
  • January 2018 (2)
  • November 2017 (1)
  • October 2017 (3)
  • September 2017 (4)
  • August 2017 (3)
  • July 2017 (2)
  • June 2017 (2)
  • May 2017 (3)
  • April 2017 (2)
  • March 2017 (2)
  • February 2017 (1)
  • January 2017 (2)
  • December 2016 (4)
  • November 2016 (1)
  • October 2016 (4)
  • September 2016 (3)
  • August 2016 (1)
  • July 2016 (3)
  • June 2016 (1)
  • May 2016 (5)
  • April 2016 (4)
  • March 2016 (2)
  • February 2016 (2)
  • January 2016 (4)
  • December 2015 (3)
  • November 2015 (1)
  • October 2015 (1)
  • September 2015 (2)
  • August 2015 (1)
  • July 2015 (5)
  • June 2015 (2)
  • May 2015 (4)
  • April 2015 (4)
  • March 2015 (3)
  • February 2015 (4)
  • January 2015 (2)
  • December 2014 (5)
  • November 2014 (2)
  • October 2014 (2)
  • September 2014 (5)
  • August 2014 (2)
  • July 2014 (3)
  • June 2014 (1)
  • May 2014 (3)
  • April 2014 (6)
  • March 2014 (3)
  • February 2014 (3)
  • January 2014 (4)
  • December 2013 (3)
  • November 2013 (3)
  • October 2013 (1)
  • September 2013 (7)
  • August 2013 (2)
  • July 2013 (3)
  • June 2013 (3)
  • May 2013 (4)
  • April 2013 (3)
  • March 2013 (2)
  • February 2013 (1)
  • January 2013 (4)
  • December 2012 (6)
  • November 2012 (4)
  • October 2012 (2)
  • August 2012 (1)
  • July 2012 (1)
  • June 2012 (2)
  • May 2012 (1)
  • March 2012 (4)
  • October 2011 (1)
  • August 2011 (1)

subscribe
+
...

Market Timing

A Market Going Nowhere, Fast...
Sunday, April 12 2015
 

Press ? for keyboard shortcuts.


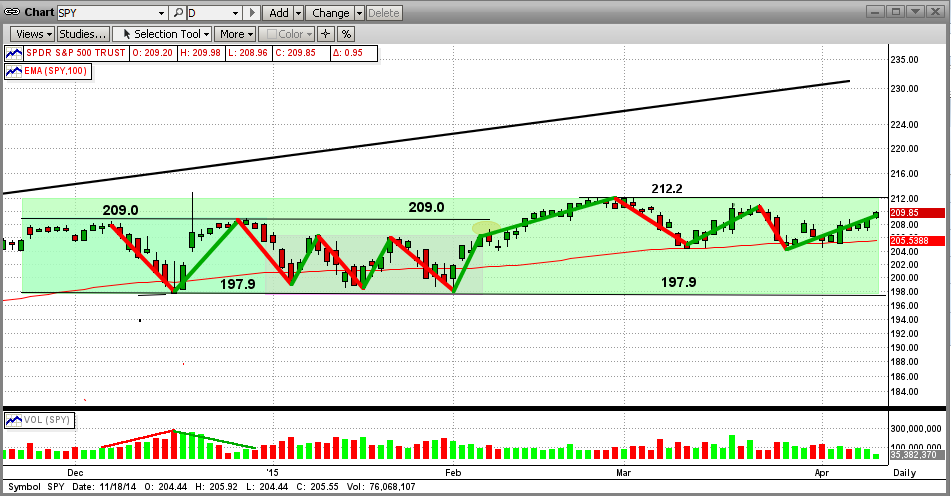
Talk about "A Market Going Nowhere, Fast" - you have just witnessed one.  For the last FIVE MONTHS, the SPY has traded in a rather tight trading range of plus-and-minus 3.5% around the mid-line of a price range between 197.9 and 212.2 (see graph below).  And, the SPY has experienced 12 short-term trend changes in this time period (if you can call them that).  Even more remarkable is that, with all of these "wild" changes, the SPY on 3/31/15 was only 0.43% higher than it was on 12/31/14. 


This has been a VERY volatile market.  For example, the Dow experienced 16 days of triple-digit moves in March alone (that's 16 triple-digit days out of 22 trading days, or 73% of the days).  These 16 triple-digit days accounted for 3,149 "swing" points for the Dow, and yet it closed less than 2% higher for the month.

The stock market continually experiences flat or sideways markets (aka "consolidation patterns"), but they rarely last 5 months.  This one is long in the tooth. The stats show that: (a) most of the time the market breaks out of the pattern in the direction from which it came in (up in our case) and (b) the longer the time frame of the sideways pattern, the bigger the following breakout move is. 

Obviously, this market has no short-term trend or direction now (other than flat-as-a-pancake), but the long-term trend is still up. The next few days are vital.  In order for the bulls to keep running, the SPY must break above the strong resistance at 212.2 (its all-time high) with some degree of strength. If that does not happen in a relatively short period of time, the bears may get rejuvenated and may finally push this market down big, at least a "correction" if not the "big one".

One positive aspect of a long-term sideways pattern is that MIPS usually gets set to "trigger" faster after being "flat" for over 100 days (think of what that does to 20-50-100 day EMAs).  Because of moves like this (or lack thereof), a small change can look big to MIPS after months of plus-and-minus 3%. 

Until further notice, we are still bullish, mainly because the long-term trend is still up.  No matter what, we will be waiting for the MIPS models to provide our future guidance (as usual).  Stay tuned...

Posted by: Dr. G. Paul Distefano AT 01:45 am   |  Permalink   |  Email
  • Home
  • Market
  • MIPS 101
  • Services
  • Subscribe
  • Performance
  • M1234/Signals
  • Nitro/Signals
  • FAQs
  • Blogs
  • About Us
  • Contact

MIPS Timing Systems
P.O. Box 925214
​
Houston, TX  77292

An affordable and efficient stock market timing tool. Contact MIPS
281-251-MIPS (6477)
E-mail: support@mipstiming.com