MIPS Members:
Since the markets (as measured by the S&P 500 and/or the Dow) have been moving sideways for over 7 months now, lots of people are saying, "This market makes no sense at all." Are they right?
Maybe or maybe not. It is very difficult to get to where you want to be if you really do not know exactly where you are now; or if you do know where you are now, but you do not have a clue as to how to get where you want to be from where you are now. The current stock market fits both of these situations.
What is confusing is that many investors do not not know how to determine where the market is now and where it might go from here. To show you what we mean, we will look at the current market from several slightly different viewpoints:
1) Short-Term movements in the markets (SPY) - Indeterminate
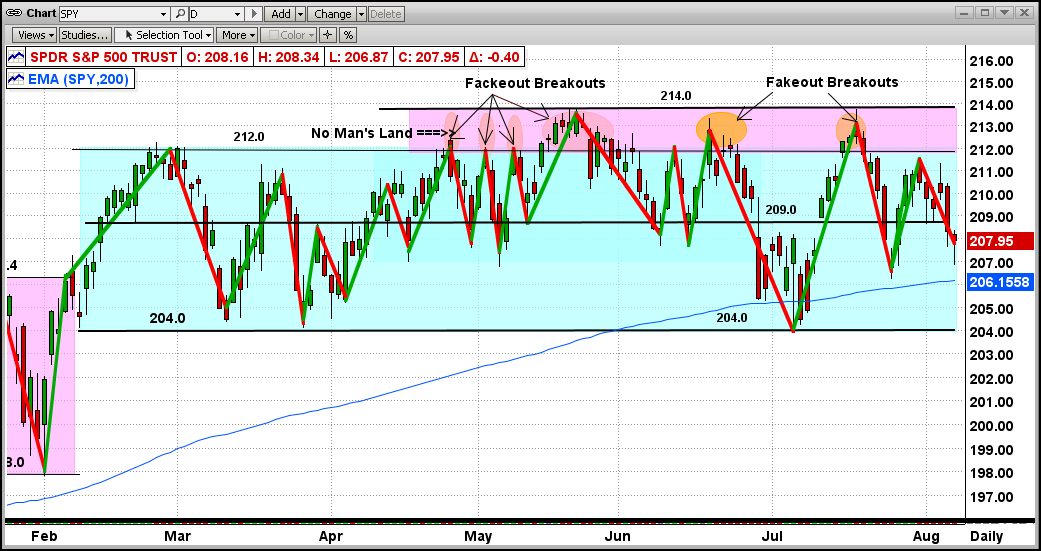
- Daily movements over the last 6 months...
The graph below shows the SPY over the last 6-7 months. It seems obvious that, from the things that we can see, it is almost impossible to determine anything useful. The SPY has traded in a tight sideways "channel" of plus and minus 2.5% around its meanline of 209.0 over the last 6 months and the market has changed direction 24 times in this 6 month period. That represents a change in direction about every 5 days !!! Most of the time, trying to react to this rapidly changing behavior (like by trying to trade faster) will lead to getting horribly whipsawed. Let's try to ascertain more from looking at this very same market period from slightly different vantage points in 2) and 3) below.
2) Intermediate-Term movements in the markets (SPY) - Bullish
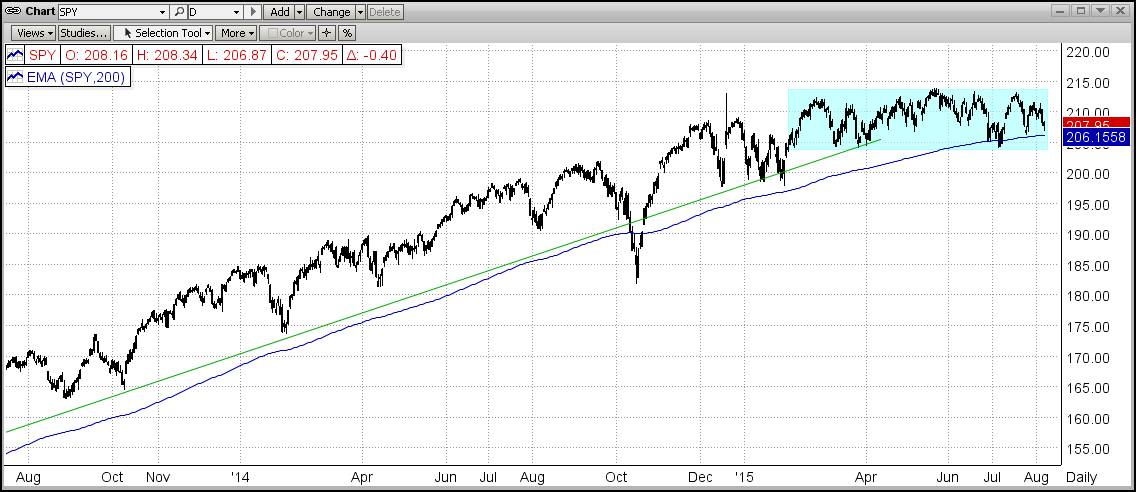
- SPY in the last 2 years...
The graph below shows what the time period above (Feb-Aug 2015 in the blue rectangle below) looks like by "backing up" over the last 2 years and viewing where the market has come from to get where it is today and where it might go from where it is now. It can be seen that the SPY had been in a steady uptrend until Feb'15, where it stalled and went into a very obvious "Consolidation Pattern". While in this pattern, neither the bulls nor the bears would "commit" their money to pushing the market out of this tight trading pattern. The bulls buy the market up to its "upper" resistance level at (SPY at 214.0), where the bears come in and sell the market back down to its "lower" support level (SPY at 204.0), over and over again.
An recent study has shown that there were only 10 times since 1950 where the S&P 500 traded in a tight 3.5% (or less) trading range for 6 months or more. And, every time this happened, these flat markets broke to the upside over the following 6 months (average +6%). This is an interesting "statistical" metric and one to pay strong attention to, but there is really no solid reason for similar behavior for the remainder of this year. [BTW - In our case today, the SPY has traded in an even tighter trading range (2.5%) over the last 6 months.]
3) Long-Term movements in the markets (SPY) - Bearish
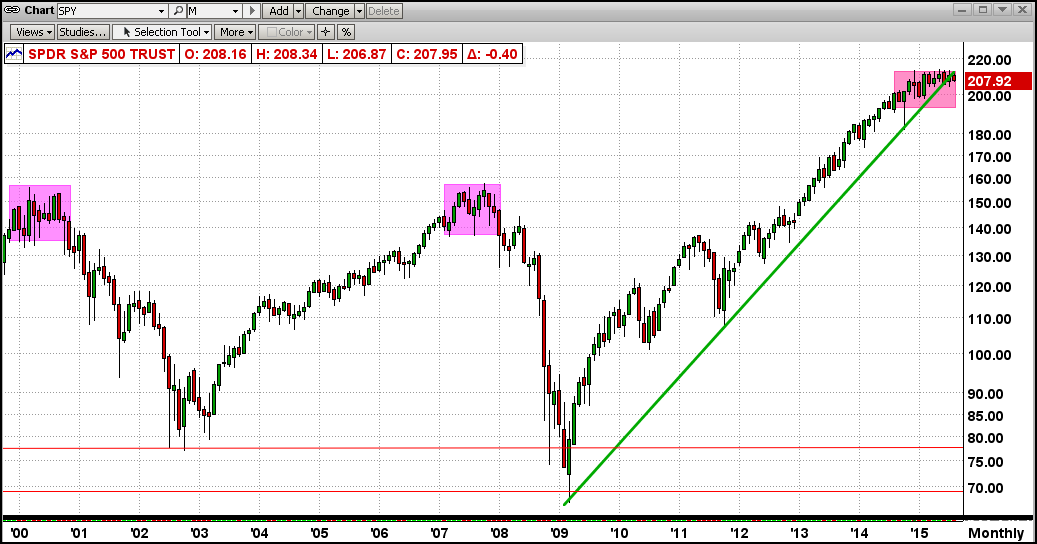
- SPY in the last 15+ years (with monthly bars)...
See the purple rectangle in the upper right in the graph below. This could very well be a so-called "Topping Pattern", like the two that preceded the big market crashes in 2000 and 2008. In both of these previous market crashes, the SPY traded in a tight plus/minus 5% trading pattern around its meanline for about 12 months each time, before crashing about 50% to the downside. In today's market, the SPY has "topped" for just about 12 months now, leading to fears of another big drop relatively soon.
BTW, my definition of the "topping pattern" behavior is a market where the big guys decide to unload most of their then current holdings over a relatively long period of time. This "dumping" process by the big guys takes a lot of time to implement in order to prevent stock prices from being driven through the floor before these fat kats unload the majority of their long positions. The fat kats sell and drive the market down 3-6%, and then they quit selling and let the little guys "buy on the dips" and push stock prices all the way back up the the top, where the fat kats start selling again. This goes on until either the little guys are fully invested and cannot buy the prices back up, or the fat kats have unloaded most of what they wanted to unload. And then, the fat kats start selling short. Along with the fat kats shorting, the little guys go into "panic selling" and drive the market down 40-50%. Of course, at this time, any big "catalyst" (like a big market crash in China, a surprise from the Fed in rate hikes, etc.) could expedite such a crash.
Obviously, none of us know what will happen from here but the above clearly defines where we are now and what could happen soon. The good news resulting from the current long-term flat market is that the MIPS "triggers" are now like "hair" triggers, and hence MIPS should react to either an upside or downside market move quickly.
Stay tuned...
PS - Please do not ignore the possibility of a big market crash and protect your nest egg now. Contrary to the outdated buy-and-hold philosophy, the next big drop will most likely NOT bounce back in the following 5-7 years as it has in the last 50 years, mainly because our economy has slowed down considerably (baby boomers no longer working, stronger competition from abroad, etc.), and the Fed cannot possibly "buy the market back up" again.
The recovery time of the next big market drop could be 25-30 years, like that after the market crash of 1929 (it took almost until 1960 for the market to reach the high of 1929, and stay above it). Or, it may be like the 35-year "non-recovery" of the stock market in Japan (the Nikkei), which dropped from 40,000 in 1980 and bottomed at 10,000 in 2010 (-75%), and which is only 20,600 today (still down 50% over the last 35 years). SO, A QUICK RECOVERY TO THE NEXT MARKET CRASH IS NOT A GIVEN !!!!


