As you all know, MIPS has held steady on its recent short signal, but most do not know why. There are two overwhelming reasons for this:
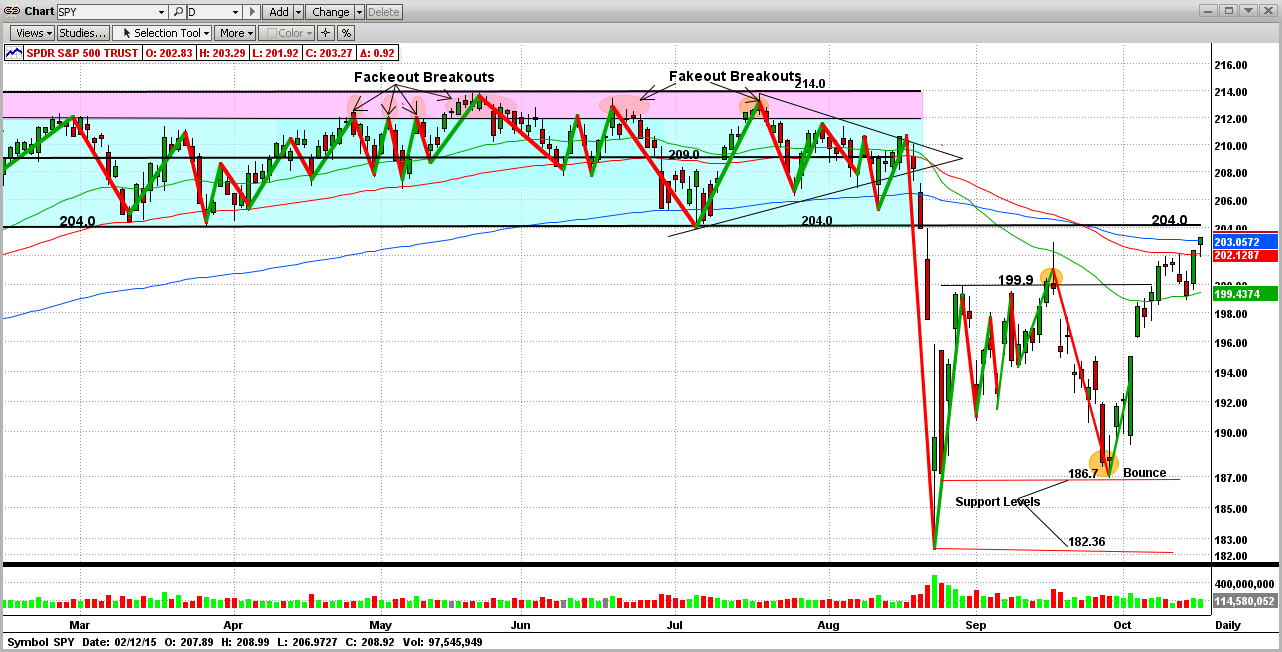
I.) After the big drop, the market has since bounced back and is going to test its most recent "support" level; which, of course, is now a strong "resistance" level at 2040 on the S&P 500 Index. Nothing new here, as the market almost ALWAYS goes back to test its "breaking points". MIPS most likely will not change its position until the SPY finishes its "shoot out" at 204.0.
Graph I - Critical Point for the SPY now - New massive "Resistance" at 204.0; which was the OLD major
"Support" level for the 9 months of Mar-Oct 2015
- this recent rally in the SPY went through the 50-EMA (green), the 100-EMA (red), and the
200-EMA (blue) like they were water
- it will be facing 204.0 soon
- this will be a CRITICAL TEST (if the SPY breaks above this, the bears will have to "give up").

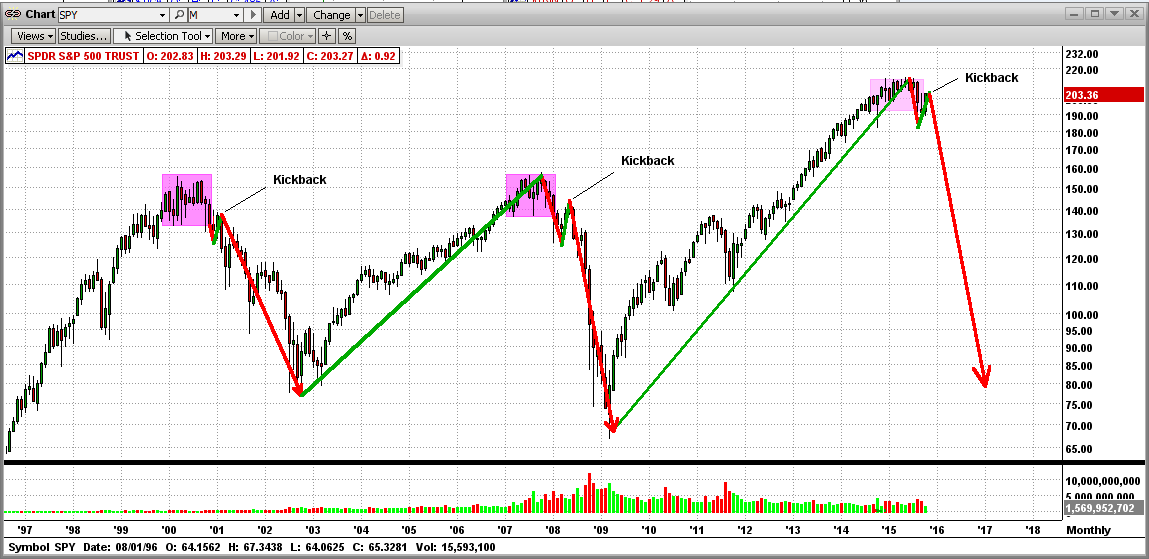
II.) The second thing that MIPS is choking on is the "topping patterns" in 2000, 2008, and 2015. Almost all pattern recognition algorithms recognize the recent behavior of the SPY as a "topping pattern", which is where the big guys dump for 10-12 months to lighten their positions in anticipation of a big drop. Of course, this is easy for them to do because they "cause" big drops whenever they decide to. Only the little guys suffer in the following several years. And, the market DOES NOT have to always come back quickly (look at the Dow in the 1930's and the Japanese stock market since 1990).
Graph II - Long-Term View
- almost identical "topping patterns"
- market looks ripe for the next "Big One" (big drop, that is)
- and notice the "kickbacks" in the big drops in 2000 and 2008 (like what is happening now)
- it still looks a little early for the 'big one", but it can happen at any time
- but, of course, the market can continue to rally higher from here 
Stay tuned...