We take drawdowns very seriously...
- in fact, we have comprehensive stats on drawdowns for all of the MIPS models
- we "track" them ourselves AND through 3rd party "tracking" companies (like TimerTrac.com, etc.)
- remember, our new algos were designed to both: (a) increase performance and (b) limit drawdowns.
A few things to look for in Max Drawdowns with all timing models are:
1) how severe is the Max DD ?
2) how many times per year do large DD's occur (and, what is the Average DD) ?
3) what is the "Average Recovery Time" ("ART") for the Max DD in the model ?
- Definition: Average Recovery Time = Max DD divided by the model's CAGR.
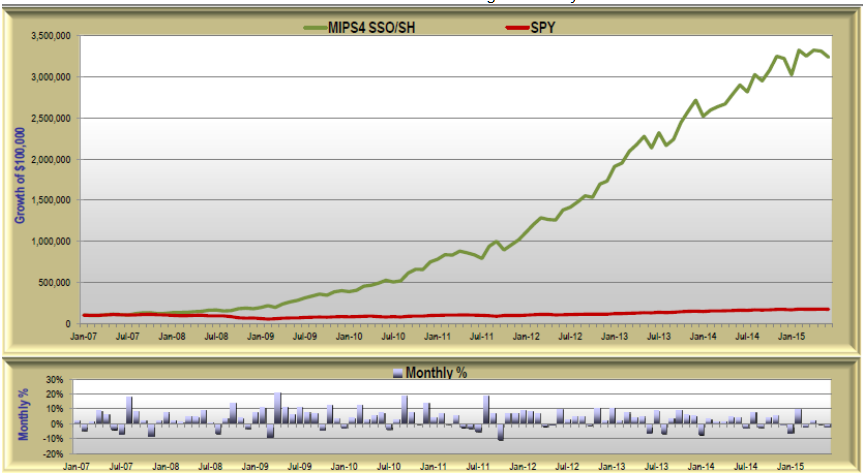
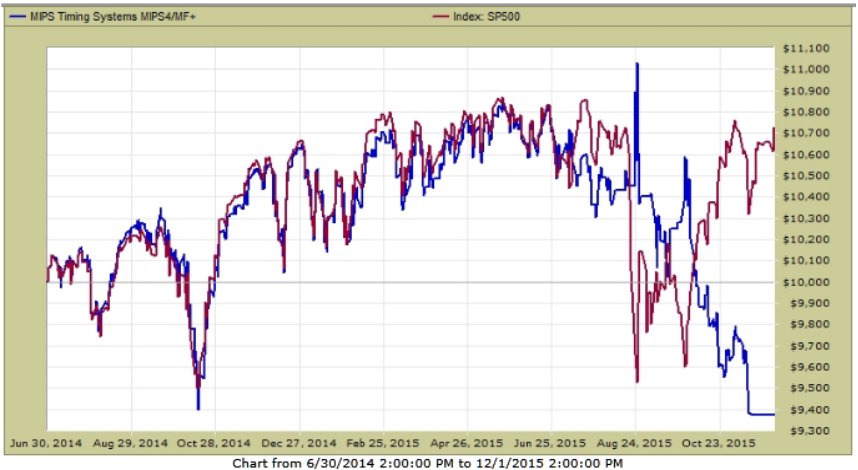
For answers to the above questions for MIPS4 trading SPY/SH, please refer to the two graphs below:
1) In Graph #1, you can see that the MAX DD between 2007-Jun'15 was 10.6%, but Graph #2 shows
a 13.8% Max DD in 2014-2015.
2) At the bottom of Graph #1, you can see that MIPS4 only had one DD greater than 10% in the
8.5 years between 2007-Jun'15, and the Average DD between 2007-Jun'15 was less than 5%,
- but, MIPS4 did have a 13.8% DD between 2014-2015 (see graph 2).
3) The "Average Recovery Time" for the Max DD of 10.6% in Graph #1 is 4.2 months; and the "ART"
for the 13.8% Max DD in Graph #2 is 5.4 months.
Graph #1 - By StatsReports (Eric Stats)
CAGR = 30.5% Max DD = 10.6% Average Recovery Time = 4.2 months
Graph #2 - By TimerTrac.com
Max DD = $9,380 / $10,880 = -13.8%
Not real pretty, but rather amazing for a model that has compounded out at over 30% (CAGR=30.5%, with no leverage), and made big $'s in 2008 (its younger brother, MIPS3, was verified up over 60% in 2008) !!!
So, stay tuned to MIPS !!!
- and enjoy the expected, long-overdue market crash in 2016...


