This blog is to show the improvements in performance that we have made in the MIPS models as a result of adding our new algorithms for markets with high-frequency directional changes (like every few days). Without algorithms like these, most timing models would get whipsawed in these fast changing environments (as MIPS did in 2015).
See the improvements:
(a) in 2015 in our previous email (excerpts below), and (b) for 2007-Dev'2015 in this new blog.
Because we have verified signals on TimerTrac.com for MIPS3, we compare MIPS3 below before and after the change in algorithms.
You will want to compare the Gold Line (after) against the Brown Line (before).
- other models are included to round out our offerings.
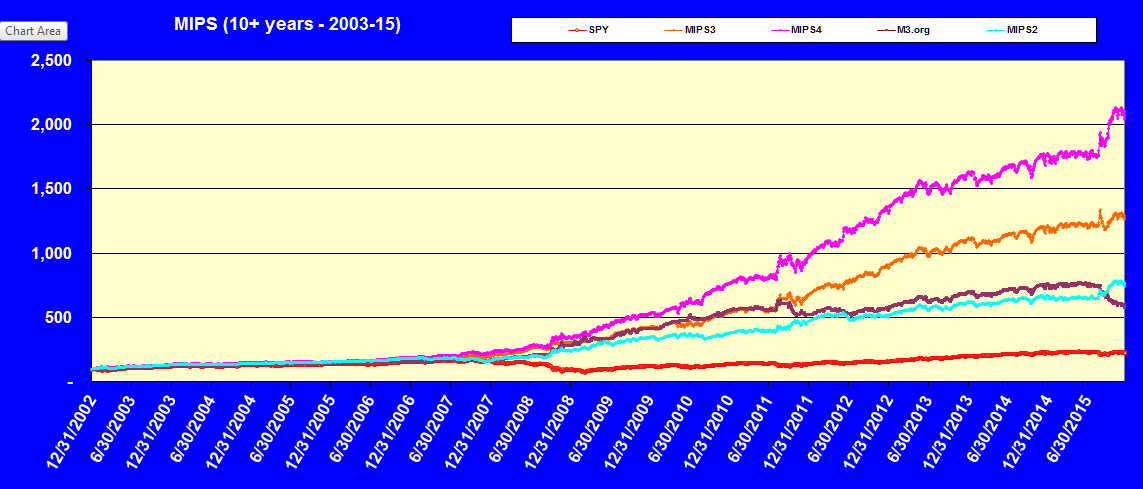
MIPS models updated with our new algos:
1) Brown Line = MIPS3 performance as it actually happened over the years
- Signals verified by TimerTrac.com
- Performance is from whichever version of MIPS3 that was in effect at the time of each signal
- Note the flat market in 2011 and the drawdown in 2015
The below is what the performance would have been if all revisions to the MIPS models were available
since 2003:
2) Gold Line = The latest version of MIPS3 including all new algos, backtested to 2003
3) Purple Line = The latest version of MIPS4 including all new algos, backtested to 2003
4) Blue Line = The latest version of MIPS2 including all new algos, backtested to 2003
5) Red Line = SPY performance
Remember, the new algos are for:
(a) high-frequency direction changes (b) in a flat market (c) over a relatively long period of time
- this is rare, so the new algos did not result in big differences in performance compared to the old algos,
except in 2011 and 2015
- see a comparable chart from the old models on our website at http://mipstiming.com/performance1
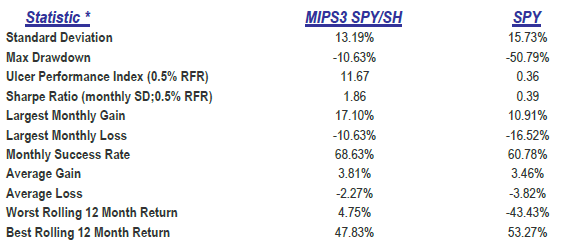
Statistics below are for MIPS3 trading SPY long/short from 2007-6/30/2015
- does not include results after 2Q'15
MIPS3 CAGR = 25%
Paul Distefano, PhD
CEO / Founder
MIPS Timing Systems
Houston, TX
 281-251-MIPS(6477)
=============================================================
<<< Excerpts from Blog on 12/20/2015 >>>
MIPS Members:
This blog is an attempt to explain what went wrong with the MIPS models in 2015, and how we have "fixed" the problems. Section I explains the perils of buying SH instead of shorting SPY on short signals in high volatility markets, and Section II attempts to explain the risk of trading in markets that are changing direction continuously in only a few days over long periods of time. Section III explains "drawdowns" and timing models in general.
SECTION I.
This first section shows MIPS4 drawdowns in 2015 that resulted from trading SPY/SH instead of trading SPY long/short. You will see that trading SPY/SH would have increased the drawdown in 2015 by 50% (from about -12% to -18%) !!!
The "standard" MIPS models trade the S&P500 Index SPY long and short
- some people believe that buying the inverse SPY500 Index (SH) will yield the same results as shorting the SPY,
but it can be much different (as in 2015).
- with high volatility, buying SH can be much different than shorting SPY (in normal times, we buy SH on short
signals; but, in highly volatile markets, we short SPY).
- in 2015, buying SH on short signals instead of shorting SPY would have lead to a 50% bigger drop
year-to-date (-18% vs -12%)
Note:
The high performance difference between buying SH on shorts instead of shorting SPY in 2015 was rare, as most of the deviation came on 8/24/2015. On that day, the overnight percent change in the SH was almost twice that of the change in the SPY. Since MIPS4 bought SH on the open of 8/24/15 and because the market recovered a large % of the overnight drop, MIPS got clobbered that day (shorting SPY would have been much less painful).
=============================================================
SECTION II.
The rest of the bad performance from the MIPS models in 2015, of course, was the result of getting whipsawed.
This "whipsawing" was a rare phenomenon that resulted from very high-frequency direction changes (every 4-7 days) over a long period of time
For example:
For the first time in its history, the SPY experienced 29 direction changes in the first 8 months of 2015 !!!
And, the Dow had a one-day 1000 point drop on 8/24/2012, one of the largest in its history (this "killed" the SH).
The things I want to point out are:
The MIPS models now have new algorithms that identify: (a) flat markets, and (2) directional changes that
are too short-term to trade.
- after our fixes for high-frequency directional changes, the MIPS models produced gains rather than nasty
drawdowns
- instead of being down between 12-18% as before, the new algorithms would have produced gains between
1% to16% for the year
- and, instead of trading an average of 17 times as with the old models, the new models traded an average of
only 10 times for the year
- this is because some of the new algorithms "stay the course" (rather than trade) under certain
identifiable conditions
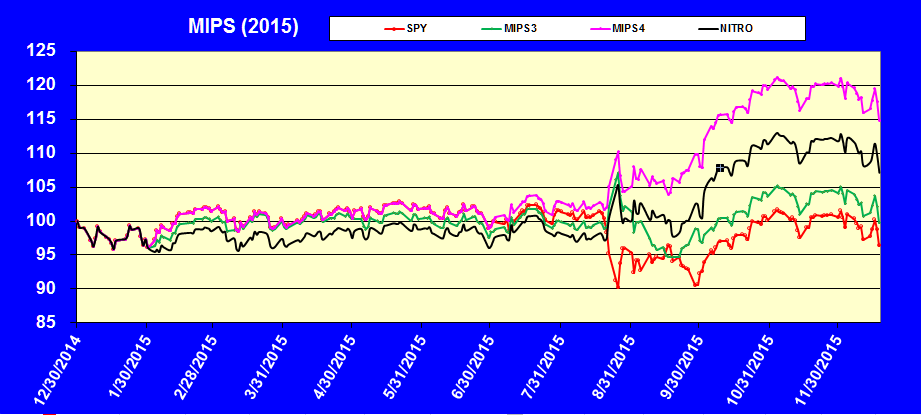
2015 with the New MIPS Models
Red line = SPY Green Line = MIPS3 Black Line = MIPS/Nitro Purple Line = MIPS4
======================================================================
SECTION III
Please remember that, although 2015 was a bad year for MIPS, it DOES NOT mean that the MIPS models are not still some of the best timing models on the market today. No mathematical model is perfect and they all have "bad periods". For example, many nuclear power plants have been shut down because the control systems could not keep the plant temperature from rising; NASA has had to "intervene" hundreds of times to keep a space ship to the moon on its trajectory because the control system cannot do it correctly for 250,000 miles; etc.
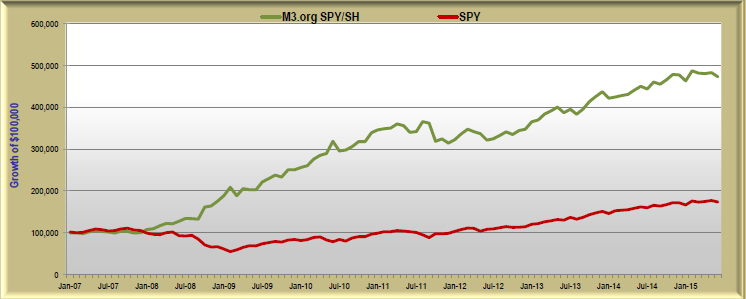
MIPS3 had a comparable bad period in 2011 and recovered nicely in 2009-2014 (see graph immediately below).
We are extremely confident that the same will happen with the MIPS models after 2015. And remember, the
current MIPS3 model is much better than the "original" M3.org model below, and MIPS4 is a much better model
than MIPS3.
MIPS3 2007-6/30/2015 CAGR = 20% Max DD = -10.6%
In our world, the Buy-and-Hold strategy has had two 50% crashes ("very large drawdowns") in the last 15 years and another one is due and coming in the next few years (or months). Both of these took rouglly 5 years to recover.
Virtually ALL of the best Timing Models on the market today that I know of, that have produced compounded annual growth rates (CAGRs) of 20% or better, have all had Max DD's of 20-25% over the last 10 years. However, most fully recovered from their drawdowns in 1-2 years.
So, what will it be ???
- Buy-and-Hold that drops 40-50% and takes 5 years to recover or
- Market Timing that drops 20-25% and takes 6-18 months to recover ???
If someone somehow could produce a model with a CAGR of 25% per year with no setbacks, this model would basically double their money every 3 years! Of course, this means if an investor started with $10,000 at age 30 (and did NOT invest any more for the rest of his/her life), with a timing model like that above, their $10,000 would have a value of about $18.5 million at age 65. And, of course, if one started with $50,000 at age 30 (with no additional investment money), they would have over $93 million at age 65. BTW, if there ever was a model this good, the developers would be able to sell it on Wall Street for at least $50-75 million. You would never see it on the retail market for $500 per year.
Because of "setbacks" as in the MIPS models in 2015, very few people will experience the above; but, they should expect to do VERY much better than buy-and-hold if they use good timing models (like the MIPS models)
Stay tuned...


