Can anyone develop a "perfect timing model"? Not at this time, but with advances in quantitative modeling (applied mathematics, artificial intelligence, pattern recognition, big data, etc.), the accuracy of quantitative modeling is improving amazingly fast. In 10-15 years, computer trading will be dominant.
In fact, outside of the investment community, the rest of the world has had "near perfect" models in use for many years now. Some examples are: (a) auto-pilot in commercial aircraft, (b) auto-control of nuclear power plants, (c) rockets that send men to the moon and back safely, and (d) fighter jet software (F-15 and F-35) that seeks, finds, tracks, and shoots down enemy aircraft amazingly fast.
Immediately below, let's look at an illustration of a "Perfect Timing Model" beating buy-and-hold in the stock market. After that, we can see how a real timing model actually worked in 2007-2017, as verified by TimerTrac.com. Then, you can determine for yourself if a model like this is "near-perfect enough" for you, or if you think that you can do better yourself.
PERFECT TIMING MODEL
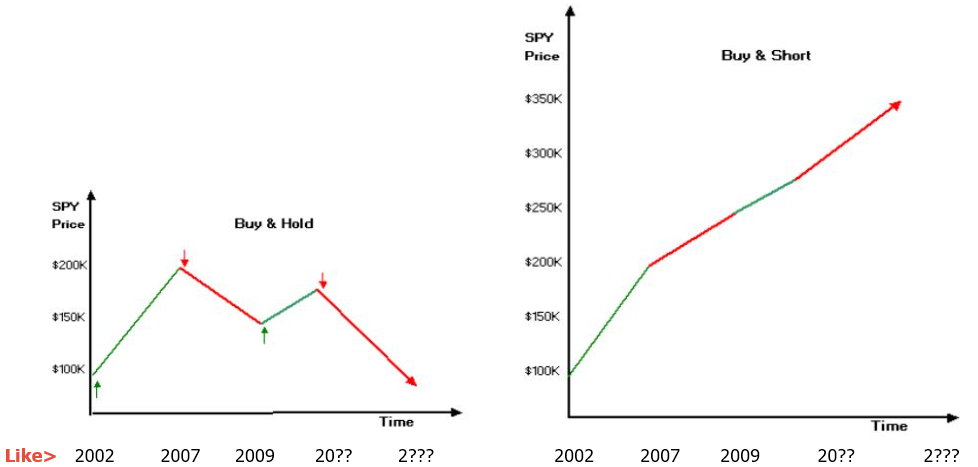
Every investor (large and small) wants to make money in both up and down markets, but they don't know how. Indeed, this is difficult but not impossible. The illustration below shows the hypothetical performance with both a Buy-and-Hold Strategy and a Perfect Timing Model (Buy/Short). Even though a perfect Timing Model does not exist, some models on the market today (like MIPS) come close as they soundly beat Buy/Hold over time.
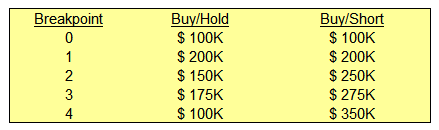
Let's suppose the market performs as in the table immediately below for 4 "Legs" of ups and downs:
I.) The middle column in the table and the graph below on the left show the performance of Buy/Hold.
II.) The rightmost column in the table and the graph on the right represent the performance of a
Perfect Timing Model.
A REAL TIMING MODEL (near perfect?)
The section shows the actual MIPS3/MF.org performance in a market moving something like that of the first 3 "Legs" depicted above, by using actual data from the period of 2007-2017 ytd (verified by TimerTrac.com). Why just 3 Legs? Because, since 2009. the market is still on the 3rd Leg. The next big drop will be like the 4th Leg above, and it is definitely coming.
If you asked hundreds of investors questions about investing in the stock market, you would get diverse answers to each question. There is one question, however, that they would all answer with a resounding "YES". That question is: "Would you have a lot more money today had you not lost 35-60% of your portfolio value in the market crashes in 2000 and 2008?"
That is why the primary objective for a stock market timing model should be to beat the major indices (like the S&P 500 ETF "SPY") in UP and DOWN markets. But, in real life, it would be more realistic to say that the objective should be to keep up with or beat the SPY in up markets, and either go to cash or soundly beat the SPY in down markets. It's sad to say that only a very few timing models meet that objective on a long-term basis. Most do well in up markets but not so well in down markets, or vice versa.
To this end, below you will find results from TimerTrac.com for our MIPS3/MF.org model between 2007 and 2017 ytd. For this, we traded with a popular investing strategy, namely 1.5x SPY Long and 0.5x SH Short (0.5x SH Short for lower risk).
|
Time Frame
|
SPY Buy/Hold
|
MIPS3.org
1.5x / 0.5x
|
| 2006 - 2007 |
+15.5% |
+20.5% |
| 2008 |
-38.5% |
+22.0% |
| 2009 - 2017 |
+170.0% |
+370.0% |
GRAPHS
The vertical "scales" on the graphs below are different from each other
(scales optimised to show the complete graph in the same space)
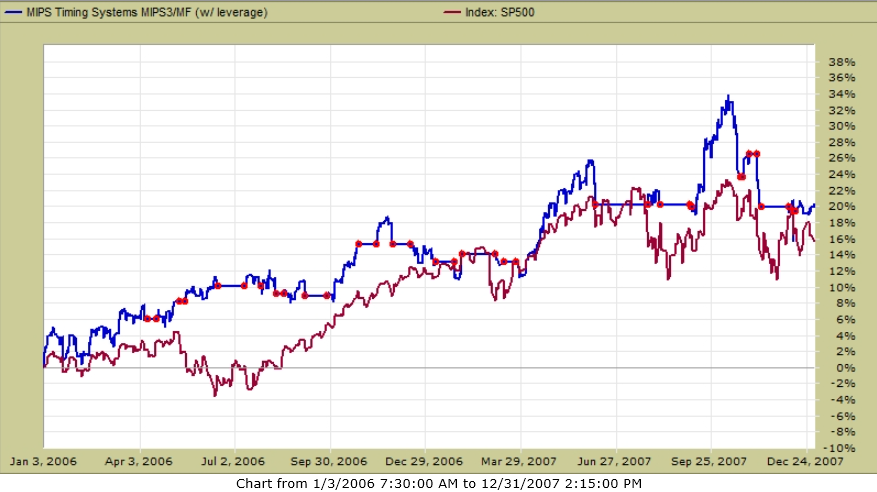
I.) MIPS3/MF.org
Trading 1.5x SPY / 0.5x SH
2006-2007 <==
Up Market
MIPS 1.5x Long /0.5x Short +20.5%
SPY Buy-and-Hold +15.5%
* Red dots designate trade dates
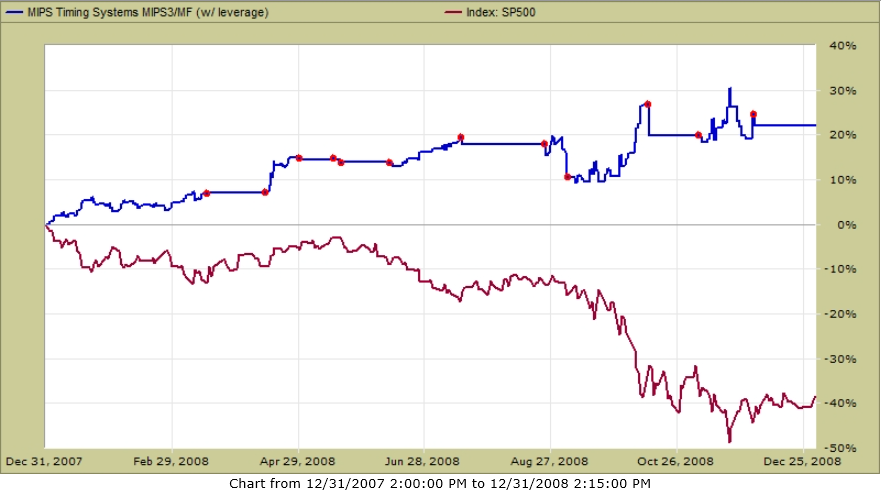
II.) MIPS3/MF.org
Trading 1.5x SPY / 0.5x SH
2008 <==
Down Market
MIPS 1.5x Long /0.5x Short +22.0%
SPY Buy-and-Hold - 38.5%
* Red dots designate trade dates
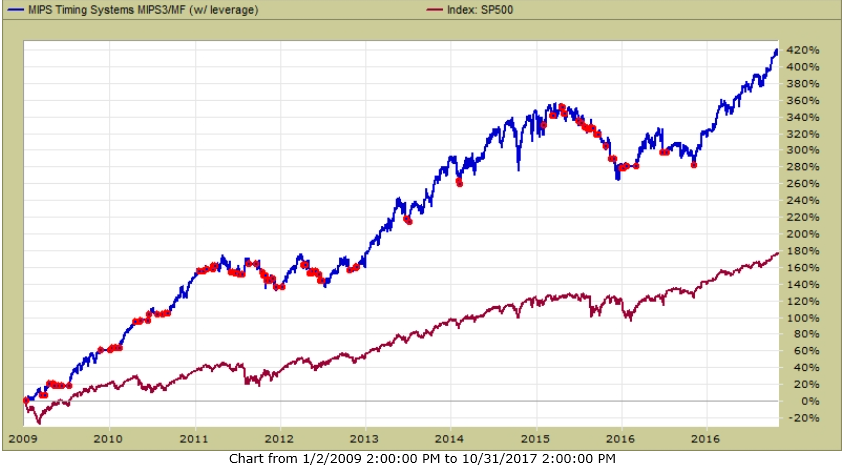
III.) MIPS3/MF.org
Trading 1.5x SPY / 0.5x SH
2009-2017 ytd <==
Up Market
MIPS 1.5x Long /0.5x Short +370%
SPY Buy-and-Hold +170%
* Red dots designate trade dates