Recently it seems that the major concern from almost all investors in the stock market is: “How much longer will this market continue to run up?” That is a very legitimate question, and it has a very simple answer (which, of course, is unusual in stock market behavior). More later …
BUT FIRST …
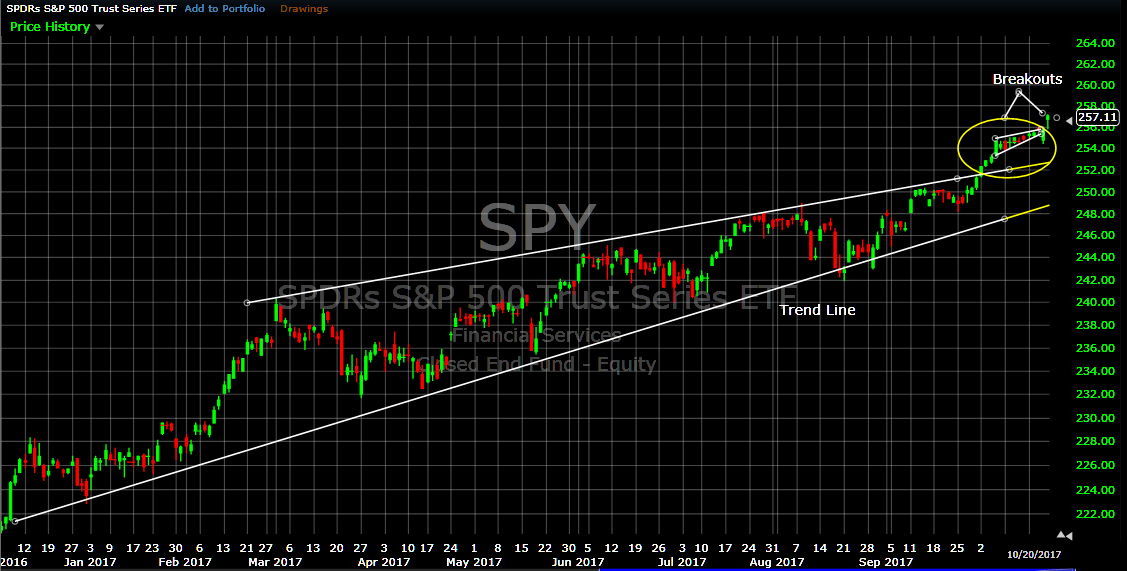
The recent Bull Run (since election in Nov’16) in this very strong Bull Market (since 2009) has been very consistent, and with very low volatility.
Some of the characteristics of this strong Bull Run are:
- Using data all the way back to 1928, this Bull Run has just tied an 11-month “streak” from the 1990’s where the market did not experience a “correction” worse than -3%.
- This is the first time in 20 years that the DOW was up for 8 quarters in a row.
- The Dow and SP500 experienced 9 monthly gains in a row, with both reaching multiple new highs in September.
Going forward, some interesting historical statistics from Market Watch (4th Quarter Reputation) are:
1) Historically the 4th quarter is the strongest quarter of the year.
2) Since 1950, the 4th quarter has been up 80% of the time, with an average growth
of nearly 4%.
3) September is usually the worst month the year, but not this year.
4) In 11 of the last 12 years, when the S&P 500 was up more than 10% through the
3rd quarter and it made a new high in September, the average 4th quarter returns
have been +5.9%.
WHAT IS DRIVING THIS MARKET?
Like almost all other times in the market, the ultimate driver of stock prices is CORPORATE EARNINGS. The market is certainly somewhat influenced by other things (like, inflation, interest rates, global instability, etc.), but these are not consistent predictors of future market direction. For example, over the last 20+ years, the market has moved both with and against inflation. So, when following anything other than earnings, usually the effect is temporary (like BREXIT) or way off in time.
From Morgan Stanley
Blue Line (Left Scale) = Earnings
Gold Line (Right Scale) = Stock Gains/Losses
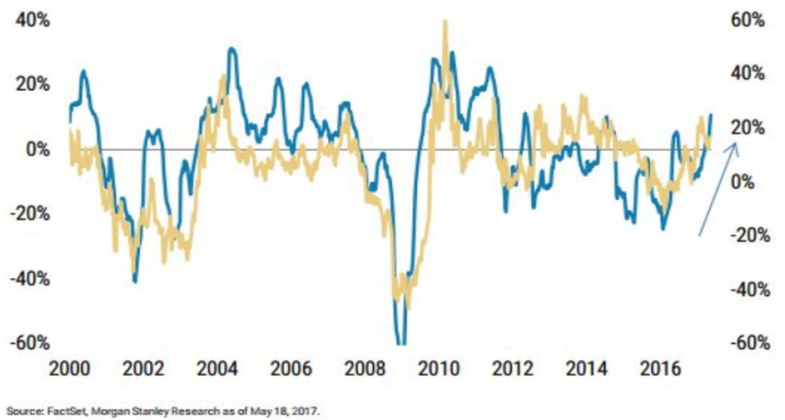
As can be seen above, stock prices ultimately follow corporate earnings. But in many cases, stock prices move first, in anticipation of earnings growth. The recent behavior in the market is a good example of this. Investors began pushing stock prices up immediately after the presidential election in anticipation of Trump’s economic agenda (fewer regulations, lower corporate taxes, better international tariffs, etc.) leading to more jobs and higher earnings. Since then, economic conditions have improved nicely and stock prices continue to rise.
So, why are so many investors so skeptical? Mainly because they feel that the stock market is greatly “oversold”, because stock prices are way too high as measured by the Price/Earnings (P/E) ratios of the major Indices. For example, the P/E ratio for the S&P 500 Index is now over 25, when the long-term average is closer to 15. That is indeed high and could lead to bad future returns; but it does not necessarily have to.
Many investors mistakenly interpret the above as a condition when prices must drop in order to bring the P/E ratio back down closer to past averages. BUT, what most of them seem to miss (or discount) is that the P/E ratio of an Index (like the S&P 500) also comes down when Earnings rise, even if stock Prices remain about the same. [Remember, the value of a “ratio” like A/B comes down when the denominator “B” goes up if the numerator “A” stays the same.] And, the “E” (earnings) in the PE ratio is now on the rise at a high pace and this should continue, given lower corporate taxes and more attractive international tariffs for US companies.
WARNING:
Please be aware that, if the economic progress in our country gets derailed (failed tax cuts, lower job creation, lower corporate earnings, North Korea, etc), the current Bull Run could (and most likely would) quickly “stop running” and it may even turn into a classic market crash.
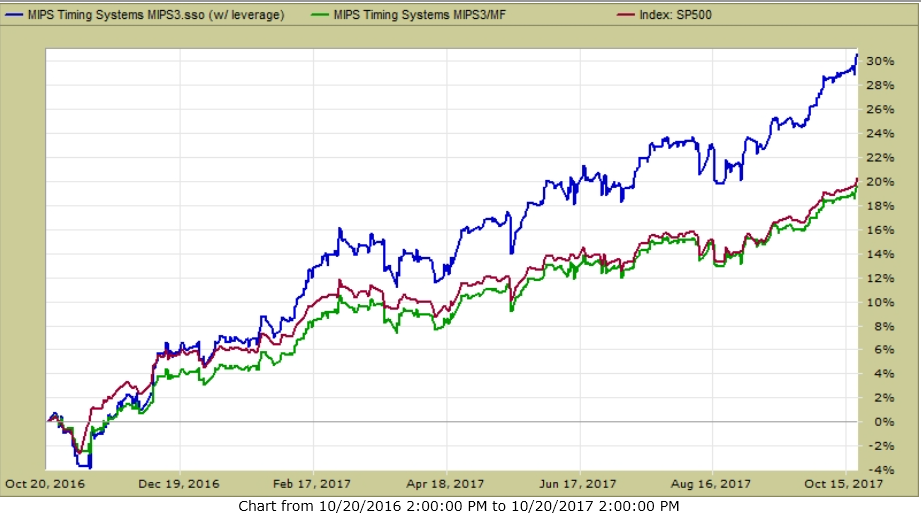
So, how have the MIPS models performed in the last 12 months?
RECENT Performance of the MIPS3 model:
- 12 months ending 10/20/2017
- with and without leverage *
MIPS3 (last 12 months)
- Trading SPY Long / SH Short
Green Line 1.5 x Long / 0.5x Short +31%*
Blue Line 1.0x Long / 1.0x Short +20%
Red Line - SPY Buy/Hold +21%
Best Wishes…
Paul Distefano, PhD
MIPS Timing Systems, LLC
Houston, TX
281-251-MIPS(6477)


