In the last few weeks, we have seen the market drop what appears to be rather dramatically; e.g., over 10% in one week (see graphs below). There are plenty of reasons being shared in the media for this, such as raising bond yields, inflation scares, overbought markets, traders taking profits, the "fat kats" heading for the hills, etc. Most likely, this mini-crash was started by trading from very short-term institutional traders (not investors) taking profits after such a recent strong run-up. This behavior has almost dominated the news, and has resulted in what could be called "panic" behavior in the markets.
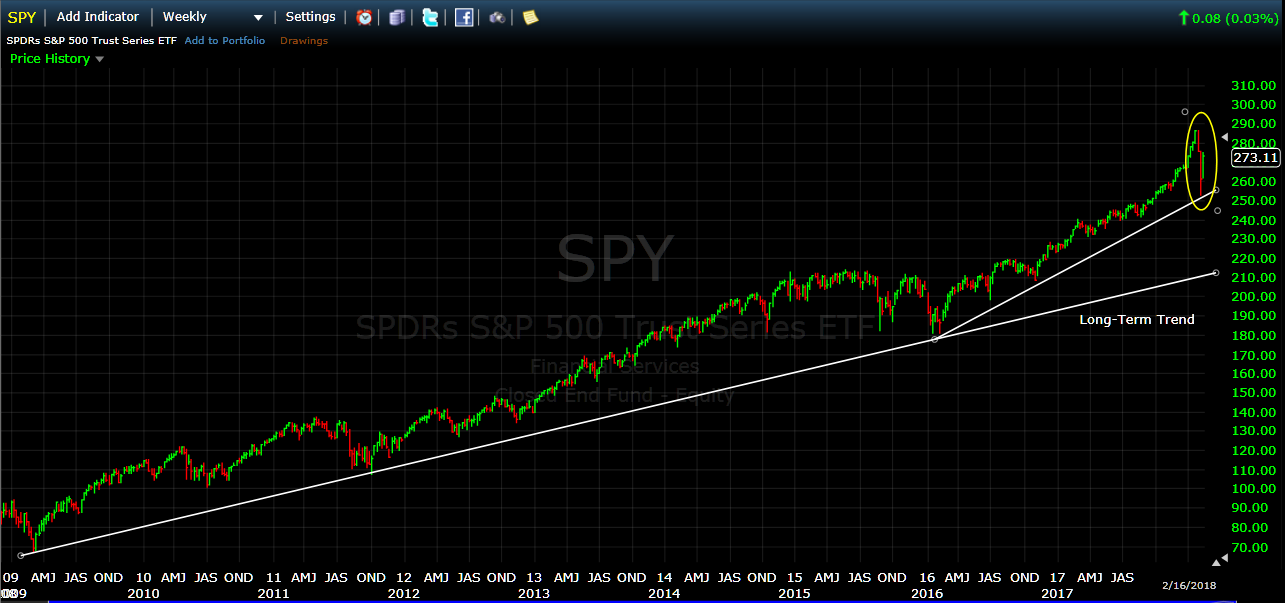
One way to put this in perspective is to look at the "long-term" view of the SPY compared to the "drop" discussed above (kind of like looking at the extent of a forest fire from an airplane). As you will see in the graph below, the SPY dropped about 10% in the last several weeks; but over the last 9 years, it has dropped over 15% several times, and droped between 6-8% many times without much fanfare. What makes this drop different is that it happened quickly (and with two daily drops in the Dow in excess of 1000 points each !!!).
So, as you can see below with all things considered, the "drop" does not seem to be as bad as it has been made out to be. We are very proud that the MIPS models were not sucked into issuing a Cash or Short signal.
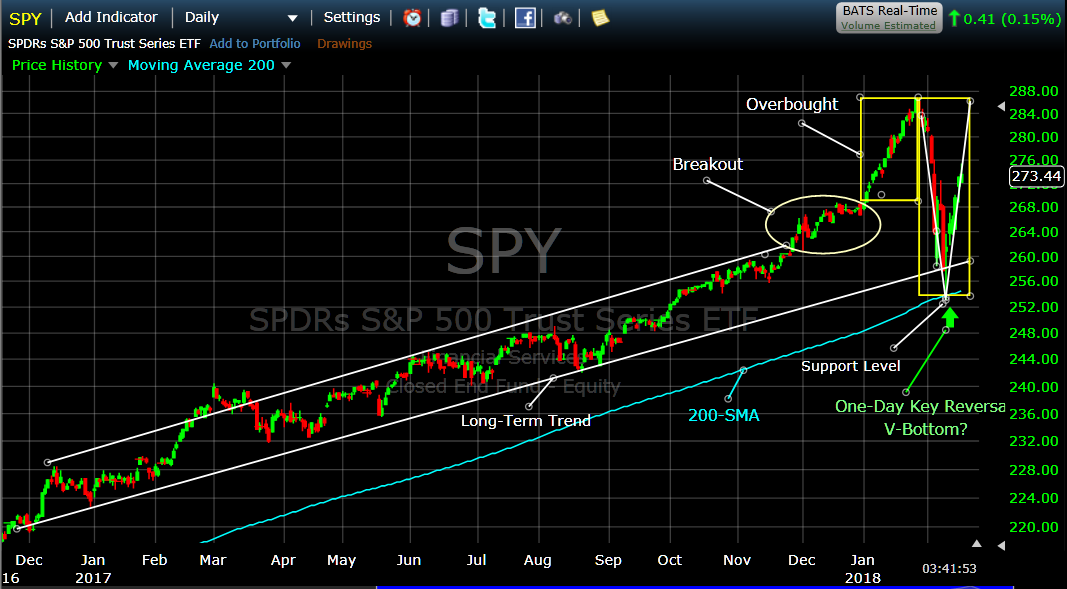
In fact, we now believe that the recent "drop" was simply what is called a "V-Bottom" pattern (see below).
A V-Bottom pattern is one where:
1) the market falls quickly in an almost straight line,
2) it almost always ends the drop with a dramatical "one day key reversal", and
3) it goes up in a path that is very similar to the path down.
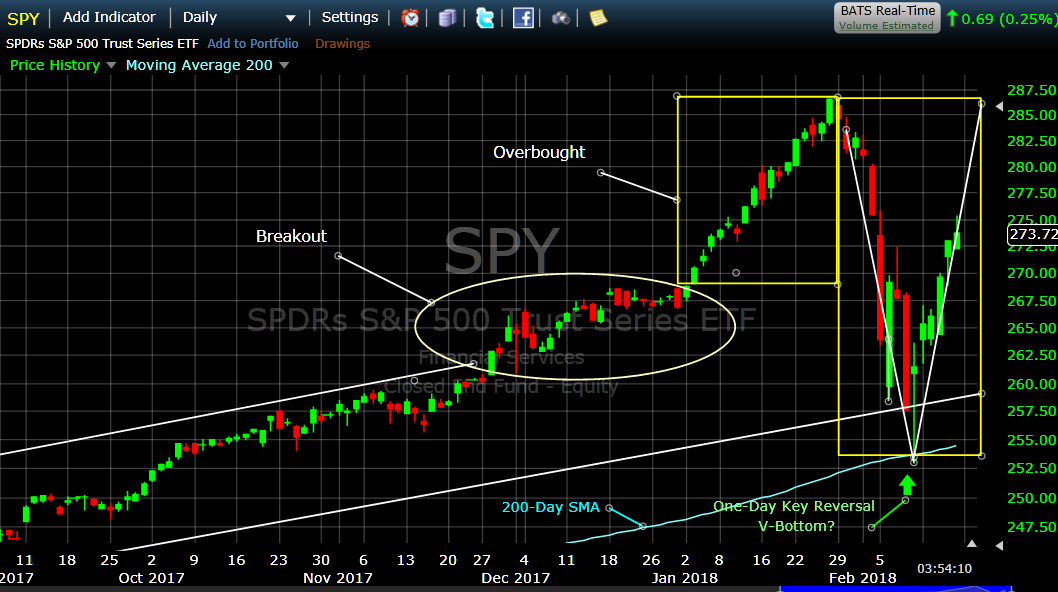
This V-Bottom in Greater Detail
I have always believed that V-Patterns are formed from the trading by very short-term traders with an amazing amount of money that trade the cash in the accounts of the biggest of the big "fat kats" (Morgan Stanley, Goldman Sachs, Pimco, etc). They almost immediately dump when they have big gains to protect and when they even "smell" a big drop coming, with little or NO regard for what they think may have perpetrated the drop. Believe me, when these guys trade the volume soars and the prices move accordingly. And, I have always believed that the reason the recovery path looks almost just like the drop path is because, after the smoke clears, these traders are buying back what they sold near the prices where they sold (see more detailed graph below).
Also, please notice that on 02/09/2018, the SPY bounced off of its 200-day moving average with great force and formed the very bullish "Up- Hammer" pattern that day.
BTW - The reason that the MIPS models DID NOT issue a Cash or Short Signal during this drop period is because our models have "Relativity" algorithms built in (as opposed to just absolute algorithms). This means that the MIPS models put more weight on % changes relative to past performance rather than just the change itself.
The net result of this would be: If the market has gone up substantially in the last 30-90 days, MIPS may ignore a 6-8% drop with no signal change; whereas if the market had been relatively flat or had only had smallish gains in this time period, the MIPS models most likely would have signaled a change even on a 4-6% drop.
Let's wait for MIPS to tell us what to do next...
- and remember, no new signal on any give day is in effect a signal to stay put.
Good Trading...
Paul Distefano, PhD
CEO / Founder
MIPS Timing Systems, LLC
Houston, TX
281-251-MIPS(6477)
support@mipstiming.com


