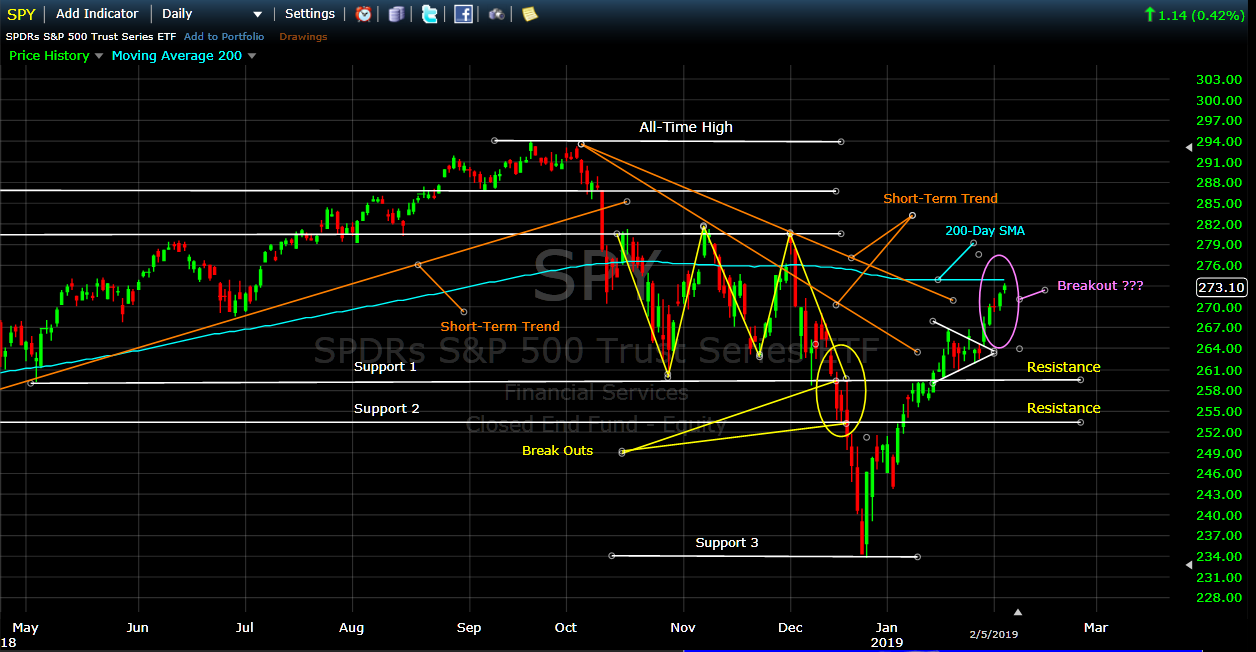
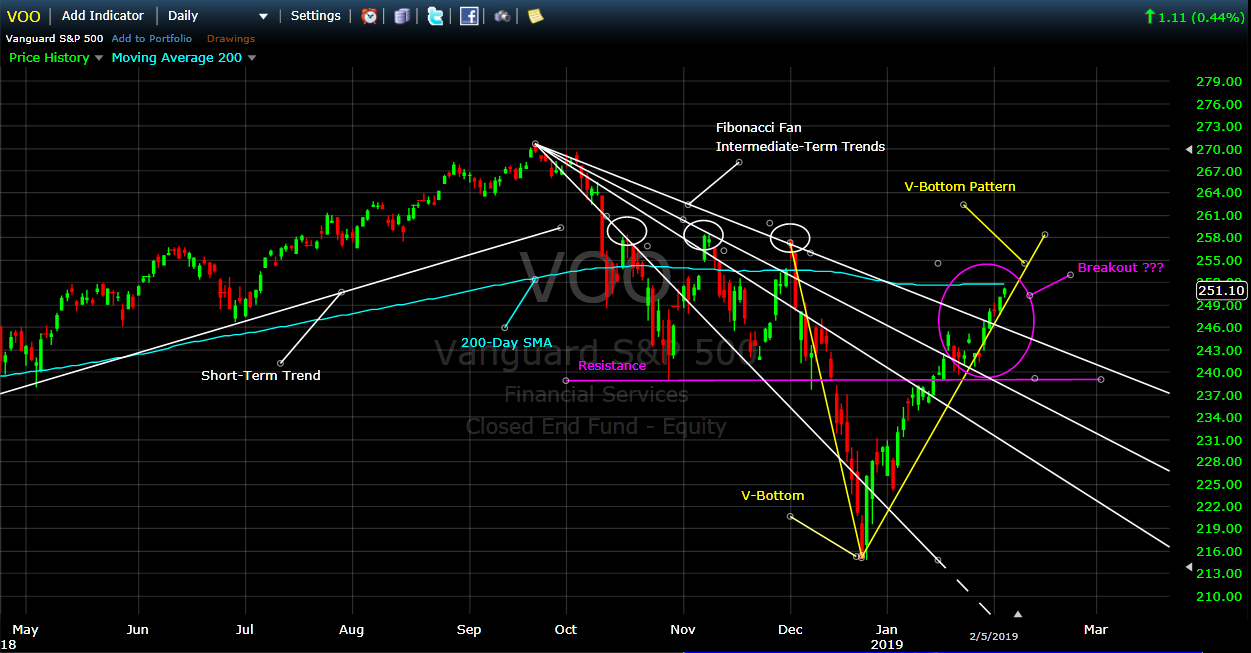
What are the charts below trying to tell us to expect (see purple ellipse on right hand side):
1) continued breakout to the up-side (following the V-Pattern) to new highs, or
2) stiff upside resistance at the 200-Day Simple Moving Average level, and maybe a test of previous lows.
Stay tuned:
- I am going to let MIPS tell me what to do, and you should do the same.
Graph #1
Graph #2
Paul Distefano, PhD
CEO / Founder
MIPS Timing Systems, LLC
Houston, TX
281-251-MIPS(6477)


