Wednesday, June 06 2012
Well, can we now answer the question from our previous email, "Is This a Correction or a Bear Trap" ?
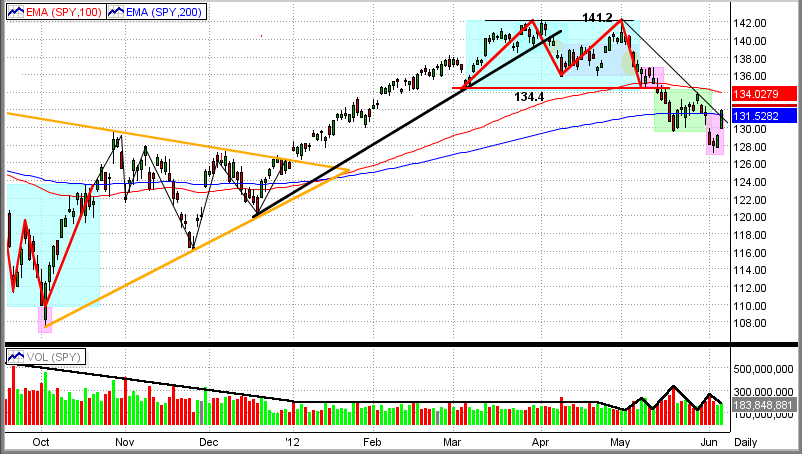
- When we look at the last few days on the graph immediately below, it sure looks like the SPY will run up from here,
officially making the downside break on 6/1/12 a "Bear Trap".
- Not only did the SPY turn back to the upside, it kind of peeked its head above its 200-day EMA (blue line) and its
short-term trendline (black line).
- On the negative side, the volume during this very short-term "rally" has been weak and is declining as the market
moves up.
- The next strong resistance is the SPY 100-day EMA at $134 (red line)
However, none of the problems that sent the market down recently are even close to being "fixed". And, none of the MIPS models (except the very long-term MIPS1/VLF model) are convinced that the market action over the last few days constitutes a "new intermediate up-trend" yet, and they stand by their "Short" signals (at least for now).
And, of course, only time will tell which direction the market will move from here, but it should only take a short amount of time to do so. Needless to say, the next few days are critical.
|


