Is the Bull Dead and the "3rd Leg Down" Starting ???
- we don't think so, but what if it is?
Read on...
Everyone, and I mean everyone, with money in the stock market knows that the bull market is the result of the Fed's stimulus, the so-called Quantitative Easing (QE3). QE3 is basically the Fed printing money at an alarming rate ($85 billion per month) and buying bonds to keep interest rates artificially low to facilitate borrowing and hence to stimulate the economy. But, it is not working (see our previous email below). Of course, the stock market likes any inflow of new capital that goes into equities, even if it is not creating new jobs, etc., and the fat cats do not want it to stop (yet).
Our Beloved Ben Bernanke (BBB) put the brakes on the bull market last week. He drastically reduced the criteria under which the Fed would start throttling back on the money printing (referred to as "tapering"). BBB raised the unemployment rate criteria for the Fed to start "tapering" from 6.5% to 7.0%. Since the unemployment rate is now 7.4%, his change brought the target much closer to today's unemployment rate. Hence, it did not take long for big investors to realize that they could not count on QE3 well into 2014, but much closer to the beginning of 2014 (or even the end of 2013). So, of course, many large investors ran for the hills.
We believe that it is possible that most of the selling last week came from big, professional "traders" who see the market horizon from a few days to a few weeks, and not from the large institutional investors who have a longer-term view of the market.
The good news is that, with MIPS, we will do well either way (see below).
The short-term view of the market looks terrible - big sell-off last week, with a down gap on Thursday. The SPY broke its 50-day EMA, but bounced off its 100-day EMA to the upside.
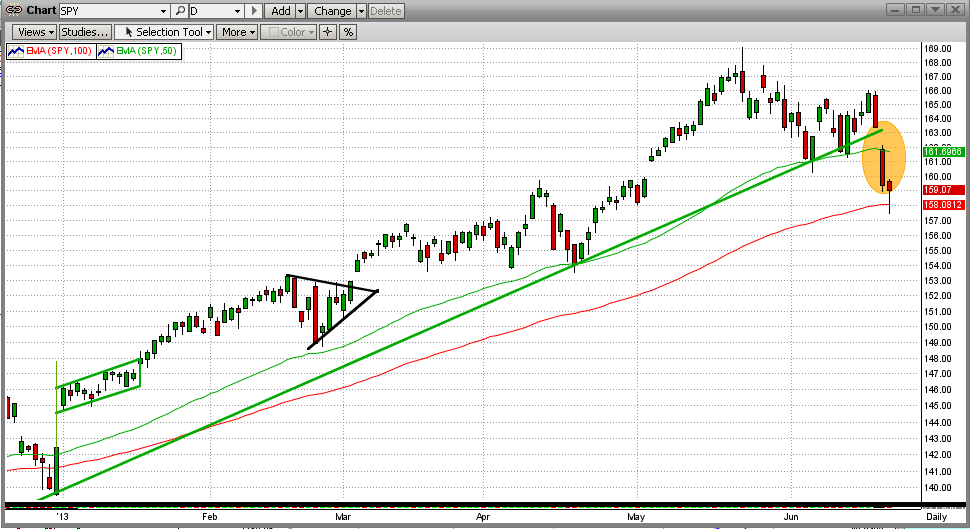
So, why aren't we worried (yet)?
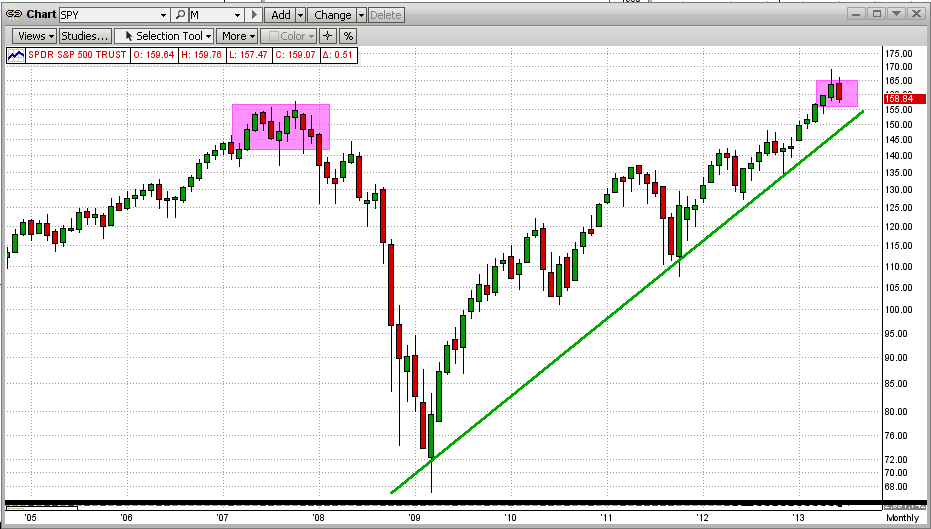
Mainly because we are intermediate-term investors and not day traders. And, a short-term drop of 3-4% does not usually signal a directional change in the stock market. Take a look at the monthly chart below. In this long-term view, the disaster on the daily chart is hardly noticeable on a monthly chart. This means that we need to wait and see.
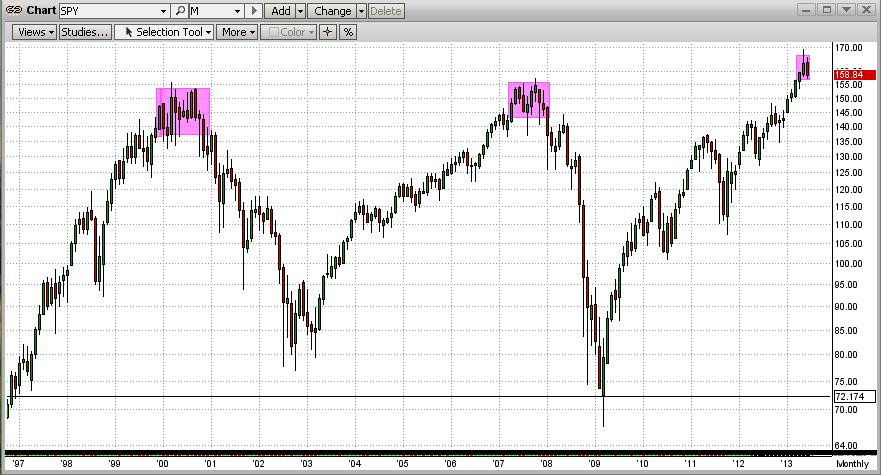
The other good news is that strong bull markets (4-5 years up) do not turn around easily or quickly. For this, let's look at the two most recent market "crashes", one in 2000 and the other in 2008. From the graph below, we can see that it took 8-10 Months for these bull markets to give up and collapse. At this time, we are only one week into a downtrend, so we have plenty time if this is the "Big One".
OK, got it. But what if is the the "Big One" ?
For that, we have to rely on MIPS. The MIPS models have been around since 2004, and the MIPS3/MF signals have been tracked by TimerTrac.com since 11/04/2005. During that time, we have had several intermediate-term downtrends and MIPS has profited from most of them (of course, MIPS beats the SPY in up markets by detecting and shorting these downtrends).
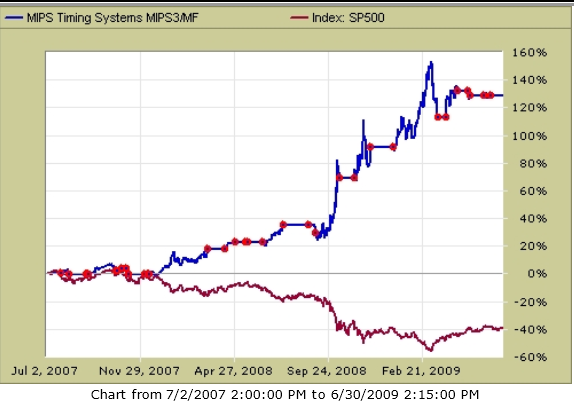
But, we have had only one really big stock market "crash" in this timeframe and that was from 4Q'07-1Q'09, when the S&P 500 dropped by over 50%. How did MIPS do in that market? For that, see the TimerTrac.com performance graph below
- see the graph below for the period of the last big market crash (mid-2007 to mid-2009)
- this graph is from TimerTrac.com using verified MIPS3/MF signals
- the "red dots" in the graph are the dates of the MIPS3/MF verified trades.
MIPS3/MF +130% SPY -40%
So, let's sleep well and wait for MIPS to tell us what to do.


