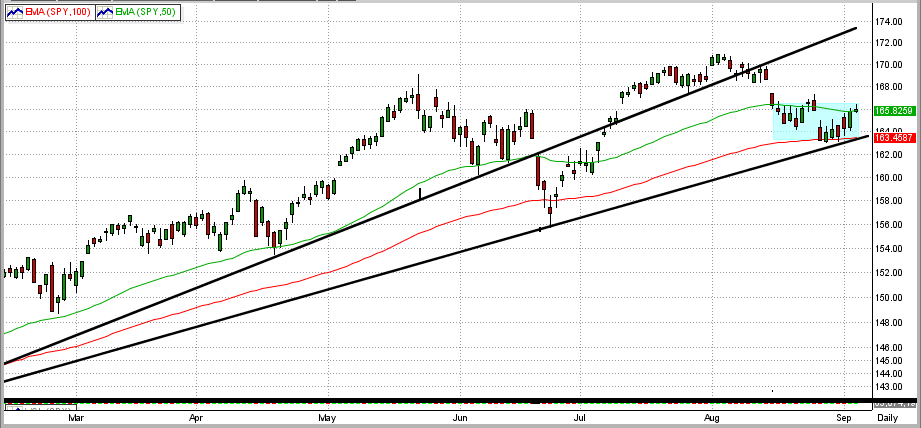
The SPY is stuck between its 50-day EMA and 100-day EMA, but not for long (see graph below):
Green Line = 50-day EMA
Red Line = 100-day EMA
Straight Black Lines = Trend Lines
Blue Box = Trading Range
In 2013, we have lived through meager gains in the economy, small setbacks, the Fed's QE3 and hints at "tapering" its purchasing of Treasury bonds, and the crisis in Syria, with the recent U.S. markets going nowhere. Sometime soon, we believe that the market will establish a new trend (up or down). It is difficult to digest all of this activity, but a technical analysis of the SPY's performance offers some insight.
The SPY broke its 6-month "primary" trend to the downside on 8/12/13.
- Then, on 8/15/13, it broke its 50-day EMA.
- In the last 3 weeks (15 trading days), the SPY has formed a trading range between the bottom of its
50-day EMA ($165.8) and the top of its 100-day EMA ($163.4).
- This is a "tight" trading range, with the top and bottom being only 0.7 of 1% around the mid-line of the trading range.
We believe that the SPY will break this range soon (up or down) and MIPS will instruct us to go long or short in due time to make money on this new trend.