MIPS Members:
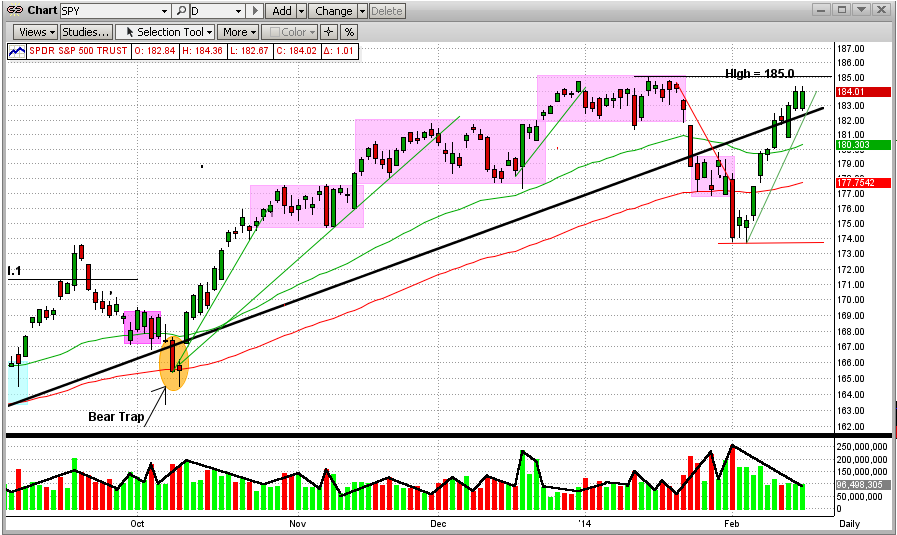
After the SPY hit or broke its all-time high resistance level at $185 for the last 5 of 6 days and got slapped back each time, it finally broke out above that level on 2/27/2013 (see graph immediately below). Although the breakout was not dramatic (no gaps, no extremely high volume, etc), it was a classic breakout. The SPY opened lower than the previous day's close, and steadily climbed all the way to $185.82 on the close on Thursday.
From this, one would expect the market to climb from here. So far on Friday (10:15 am CST), all of the major indices are up (with the SPY up +0.5%). For how long and how high this continues, we will have to wait and see. All of the MIPS models are still long at this time.
<<< Previous Blog >>>
MIPS Members:
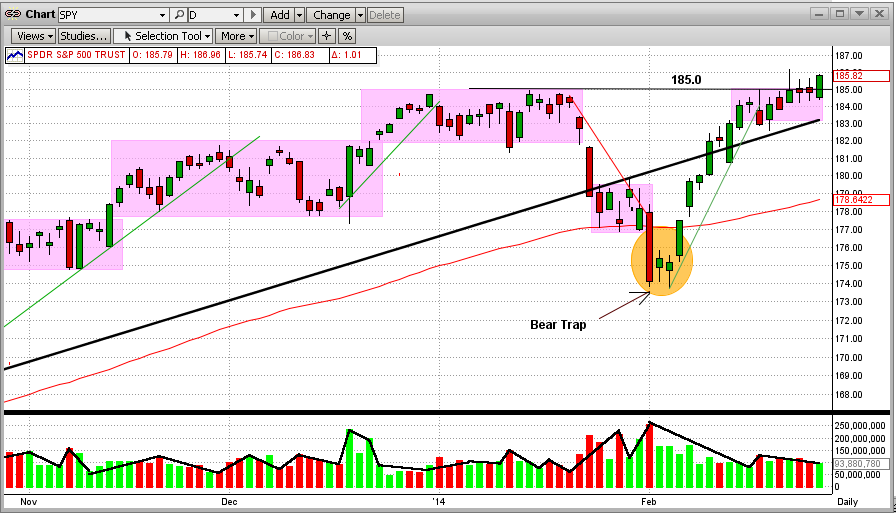
In our previous blog below, we pointed out how the SPY had made a dramatic change in direction in the first week of Feb'14, and turned up in what seemed to be a powerful uptrend. But, the uptrend lacked strong momentum due to the low volume in this uptrend. In other words, the uptrend was the result of buying by the little guys and was NOT joined by the fat kats.
So, what has happened since then? The SPY uptrend hit what I call a chartist's "stone wall" at its previous all-time high of 185.0 (see chart immediately below). And, by the way, the SPY tried to break through 185.0 in 3 of the last 4 trading days, only to be slapped back at exactly 185 all 3 times. The little guys could not push the SPY through the 185.0 resistance level all by themselves. And, they will not try this alone much longer. My opinion is that, if this market gets some support from the fat kats, the SPY will continue up to new highs. But with the little guys alone, it cannot. The SPY volume levels will be high on my radar screen next week.
And, of course, if the little guys give up or the fat kats go against them, the SPY will most likely fall back to its support level at 174, or below.
It's so good to put the decision of what to do on the shoulders of the MIPS models so we can sleep at night. Let's wait for MIPS to tell us what to do, and when.
<<< Previous blog >>>
MIPS Members:
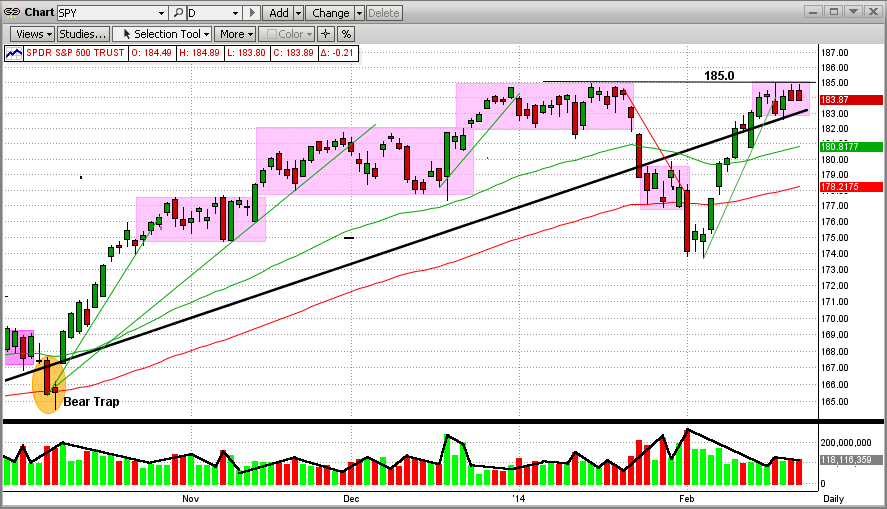
The market has undergone a remarkable rebound so far in Feb'14 (see graph below). In the last 10 days, the SPY regained almost all of the ground that it lost in the 10 days before that. Problem is, however, that the rebound thus far has been on ever decreasing volume, so it was not caused by the big guys.
So, where does the SPY go from here. From global economic conditions, the actions of the Fed, and the market's technical indicators, one could make a good case for the SPY to go up (to over 200) or down (to below 160) from here. And, we at MIPS sure don't have a prediction either way at this time (but MIPS will in ample time).
If outside conditions don't greatly surprise us, we believe that the SPY will go up and try (at least several times) to break through its previous high of $185 to the upside. If it does, there is not a consensus top where it may play out. On the other hand, if the SPY fails to break its previous high (again, after several tries), it will most likely drop all the way back to $174. And, if it breaches its support at that level, then look for it to fall to 160 or lower. The worst case is that the SPY goes into a sideways trading pattern between 174-185, thus developing into a pattern that is ripe for whipsawing.
We will wait for the big guys to make up their minds and start their move, and then let MIPS tell us what to do, and when.