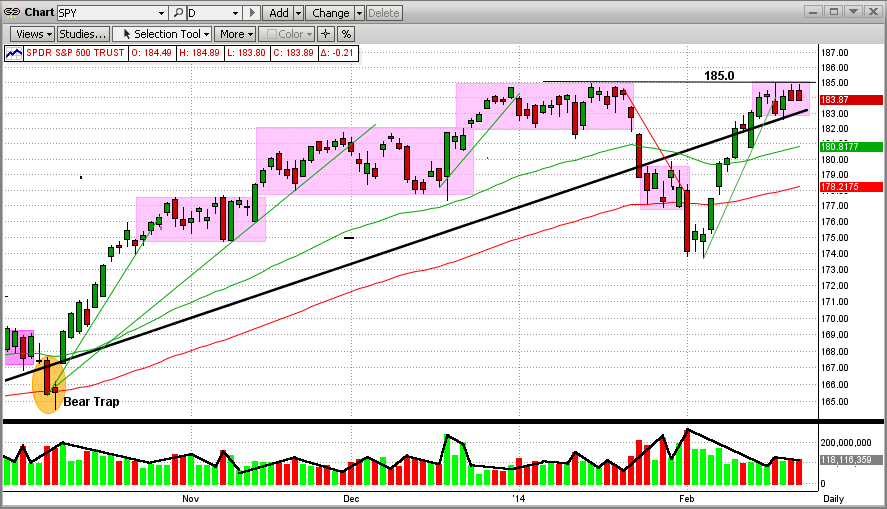
In our previous Blog below, we showed a breakout of the SPY above its all-time high level of $185 on 2/27/2013 (Thursday) and a confirmation of this breakout on Friday. After a single day of dealing with Putin's ego on Monday (SPY back down to close a fraction below $185), the SPY bounced back up today to $187.85 (new high). And, it was very comforting to see higher volume on the up days (see graph immediately below).
All of this is good news for the bulls. The market should push even higher in the short-term (weeks/months). For this to actually happen, however, we need to see continuing higher levels for the SPY from here or at least several solid days above $185. Most likely, the SPY will come back down to test this new $185 support level and the SPY must "hold the line" there for this "breakout" to be real and lasting.
Still, its anybody's guess. To our benefit, we have MIPS to tell us what to do (all MIPS models are still long).
<<< Previous Blog >>>
MIPS Members:
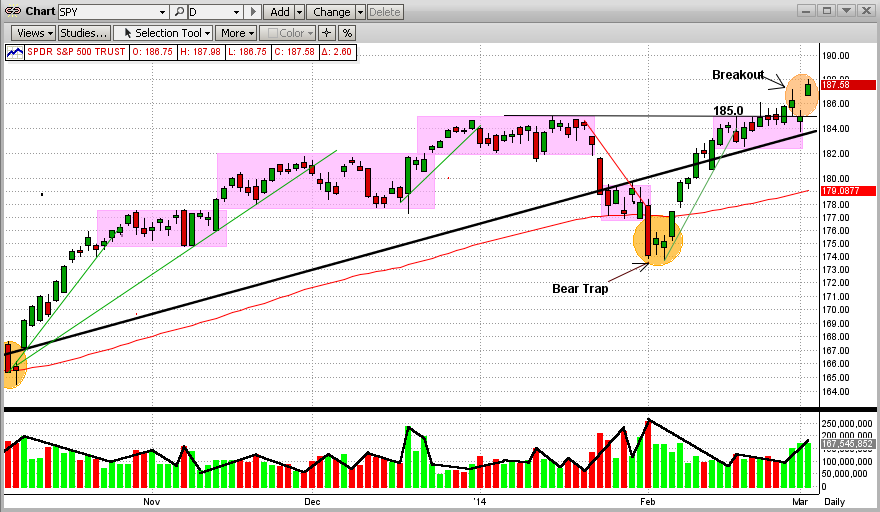
After the SPY hit or broke its all-time high resistance level at $185 for the last 5 of 6 days and got slapped back each time, it finally broke out above that level on 2/27/2013 (see graph immediately below). Although the breakout was not dramatic (no gaps, no extremely high volume, etc), it was a classic breakout. The SPY opened lower than the previous day's close, and steadily climbed all the way to $185.82 on the close on Thursday.
From this, one would expect the market to climb from here. So far on Friday (10:15 am CST), all of the major indices are up (with the SPY up +0.5%). For how long and how high this continues, we will have to wait and see. All of the MIPS models are still long at this time.
<<< Previous Blog >>>
MIPS Members:
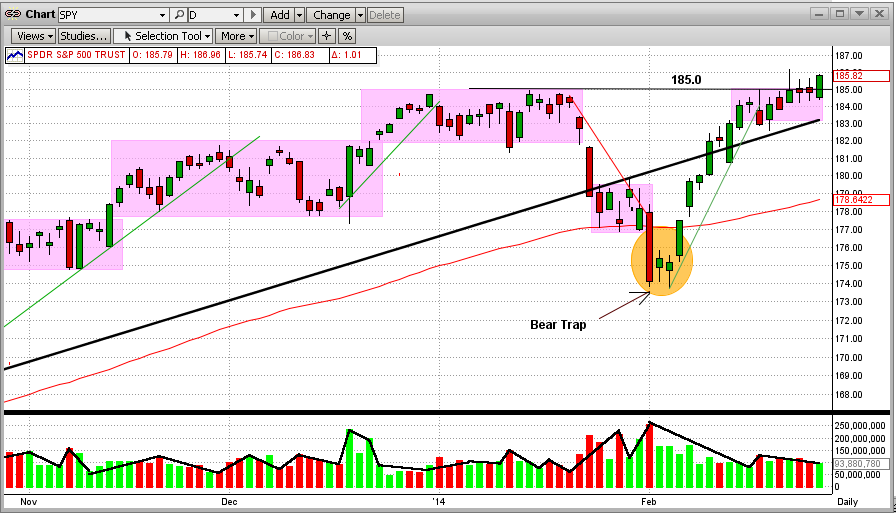
In our previous blog below, we pointed out how the SPY had made a dramatic change in direction in the first week of Feb'14, and turned up in what seemed to be a powerful uptrend. But, the uptrend lacked strong momentum due to the low volume in this uptrend. In other words, the uptrend was the result of buying by the little guys and was NOT joined by the fat kats.
So, what has happened since then? The SPY uptrend hit what I call a chartist's "stone wall" at its previous all-time high of 185.0 (see chart immediately below). And, by the way, the SPY tried to break through 185.0 in 3 of the last 4 trading days, only to be slapped back at exactly 185 all 3 times. The little guys could not push the SPY through the 185.0 resistance level all by themselves. And, they will not try this alone much longer. My opinion is that, if this market gets some support from the fat kats, the SPY will continue up to new highs. But with the little guys alone, it cannot. The SPY volume levels will be high on my radar screen next week.
And, of course, if the little guys give up or the fat kats go against them, the SPY will most likely fall back to its support level at 174, or below.
It's so good to put the decision of what to do on the shoulders of the MIPS models so we can sleep at night. Let's wait for MIPS to tell us what to do, and when.