The SPY proved today (March 21) that the market's "Stone Wall" that has prevented it from surpassing its all-time high is still there.
To see this plainly, please look at Graph #1 below:
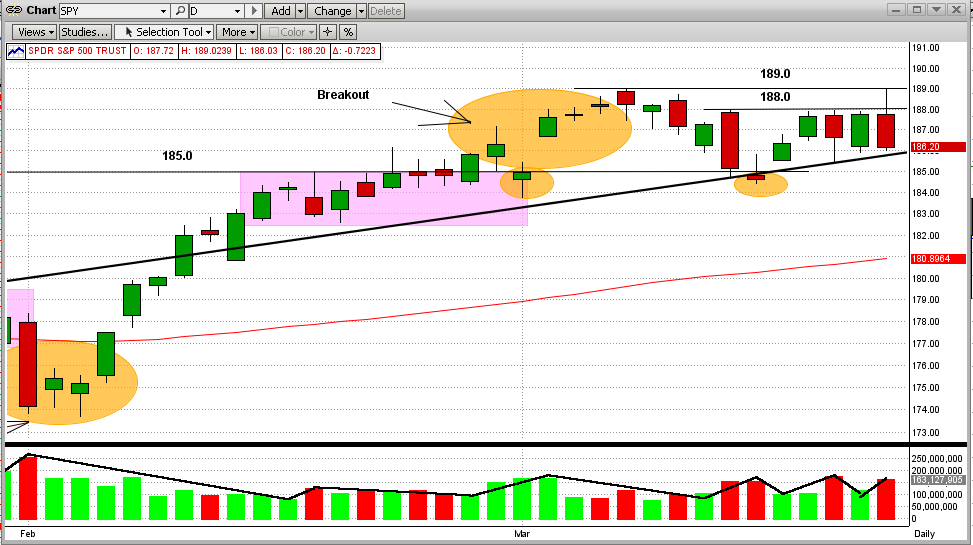
1) The SPY hit its all-time high at $189 on 3/07/2014.
2) Then it trickled down for a few days followed by a big drop on 3/13/2014.
3) The SPY bounced back on the intersection of its trendline and support level at $185.
4) This uptick met an abrupt halt at $188, exactly where the big drop started several days before.
5) Since then, the SPY has tried and failed 3 more times to break above this "Stone Wall" at $188.
6) In fact, early today the SPY did pierce this level and climbed all the way to the all-time high level at $189,
only to be slapped all the way back down to the low of the day at $186.2 (see the 2nd Graph below).
7) The volume on down days was higher than on up days (bearish, but certainly not conclusive).
These movements in the SPY are more pronounced in Graph #2 below
Graph #1
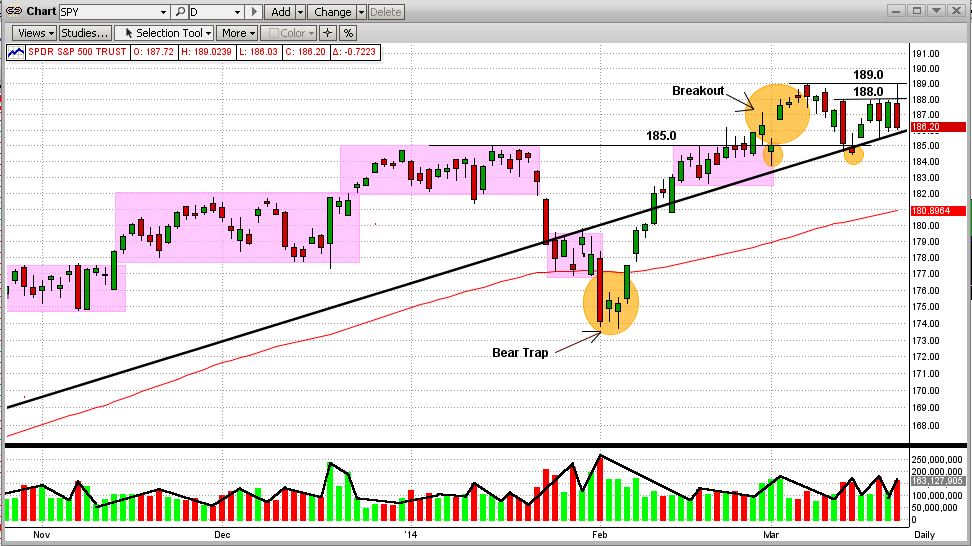
In Graph #2 below, the SPY now appears to be in an "Reverse Pennant" or "Widening Wedge" pattern, either or both of which could prove to be bearish. As we all know by now, there are plenty of reasons why this market should have had a correction by now and really only one big reason why it should continue to climb higher. However, the one big reason (the Fed) is starting to lose traction.
It's anybody's guess where the market will move from here. But MIPS does not guess, it calculates all the likely options and chooses the one with the highest probably. And, it almost always beats my guesses.
Graph #2