Are we in an up market now? It may look like one or feel like one, but that does not make it one. Besides, to answer that, we need a time frame. Over the last 5 years, we have definitely been in a strong up-market.
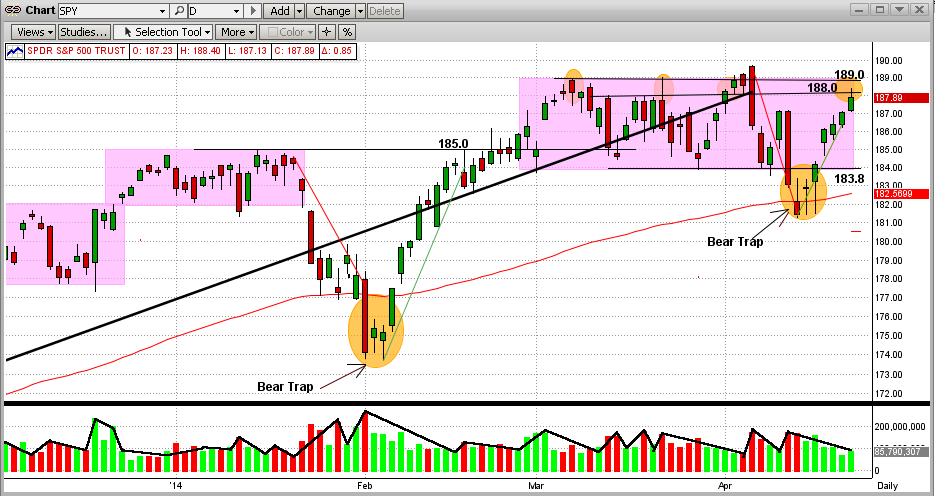
OK then, what about now? Well, the SPY has basically been relatively flat for most of 2014. Since the beginning of the year, the SPY is up about 4%, but almost all of that has happened in the last 6 days !!! See the graph below.
Short-term, we can see that the SPY has been in a "trading range" of 183.8-188.0 since the beginning of March 2014. We had a big drop near the beginning of April, when the SPY dropped from an intraday high of 189.6 to a low of 181.2 (-4.4%). That drop ended in a "bear-trap", when the SPY reversed itself the very next day and climbed all the way back to an intraday high of 188.4 today (and a close at 187.9). That's a gain of almost 4% in six days (impressive, but on low volume).
The worry comes from the fact that the SPY is very close to going back into "no-man's-land" (the "strip" between 188-189 on the SPY) for the 4th time in the last seven weeks !!! What happens next is anybody's guess. I will not feel comfortable on the upside unless the SPY breaks and holds above 189 for a few days/weeks (remember, where there are Bear Traps, there can also be Bull Traps).
By definition, what we can see is "on the surface". Even though our Market Strength Indicator sees a little deeper, it is not nearly as comprehensive as the MIPS models themselves ( http://www.mipstiming.com/msi___mips_members ). That is, the market could look weak on the outside (like in the most recent Bear Trap in the graph below), but the MIPS models were not "fooled" by what was happening only on the surface. While the surface looked weak, the guts were indeed stronger.
Sleep well, we have MIPS doing all of the heavy lifting
