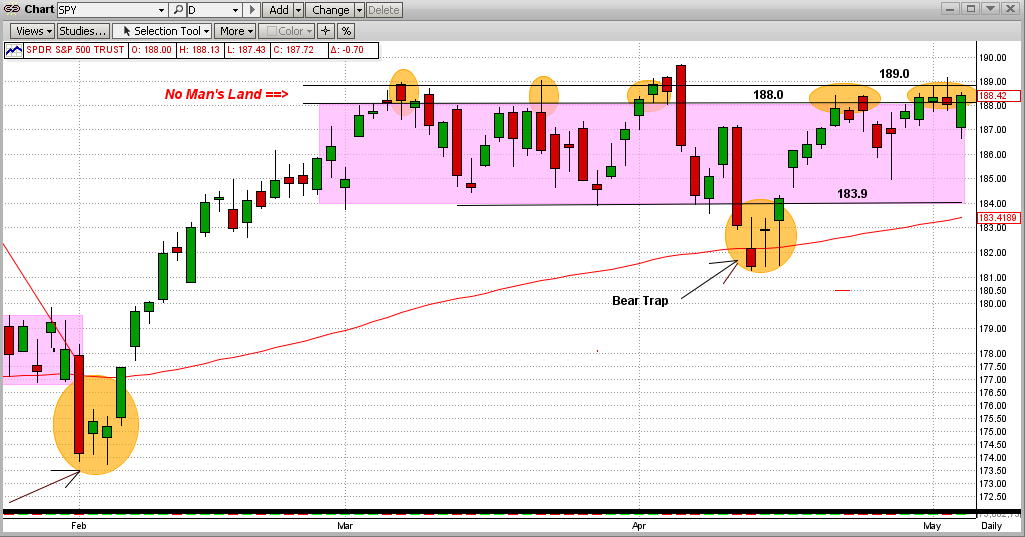
On yesterday's close, the SPY again stuck its head above 188.0 into No Man's Land (e.g., between 188.0 and 189.0). In fact, there is a very interesting phenomenon going on in this very tight range. Let's look at the stats from the graph below.
1) The SPY has been in a rather tight, sideways trading range since 3/03/14 (for over 9 weeks). This is also called a flat or horizontal "pattern", and 9 weeks in this pattern is somewhat rare.
2) The SPY has not been able to break firmly above its strong resistance level at $189.0/share except for a few hours on 4/04/14, then it got "slapped" back down. And, in the entire time period, the SPY hit or stuck its head above the 189.0 level seven times, again only to be slapped back each time.
3) Anomaly - the SPY had been "trapped" in the trading range of 188.0-189.0 (No Man's Land) five times during this period (see orange ellipses in graph below). This is very unusual. In fact, the SPY has hit 188.0 or closed in No Man's Land 23 days (or 47% of the time in the sideways trading range). So far, every time the SPY has stuck its head above the fence at 188.0, it got slapped back to the lower end of the trading range (184-185).

Of course, the SPY will not stay flat forever. It will break out of this flat trading range, and most likely soon. And, when it does, the market's move up or down from the trading range will be bigger the longer the SPY was in the flat pattern.
Which way will it break?
We need to trust MIPS to answer that.
 |
|


