This blog is an update to our previous 8/19/2014 email (shown below this current email). That was when the newest short-term trend, which started in late-May 2014, went into a big dip on 7/25/2014, and then started a recovery from this Bear Trap on 8/18/14, had just worked its way back into the green-line up-channel.
Since then, the SPY continued the up-trend for a few days (gold trendline) and then went into a 14-day sideways trading pattern (pink box). Today, the SPY "tested" the sideways pattern bottom (pink), the intermediate-term trendline (black), and the bottom up-channel trendline (green), and "held-the-line" on all three (see graph immediately below).
Legend:
Green Curved Line = 50-Day EMA
Red Curved Line = 100-Day EMA
Black Line = Intermediate-Term Trend Line
Green Lines - Short-Term Trend Lines
Purple Box = Sideways/Flat Trading Pattern
Orange Circles = Significant Points
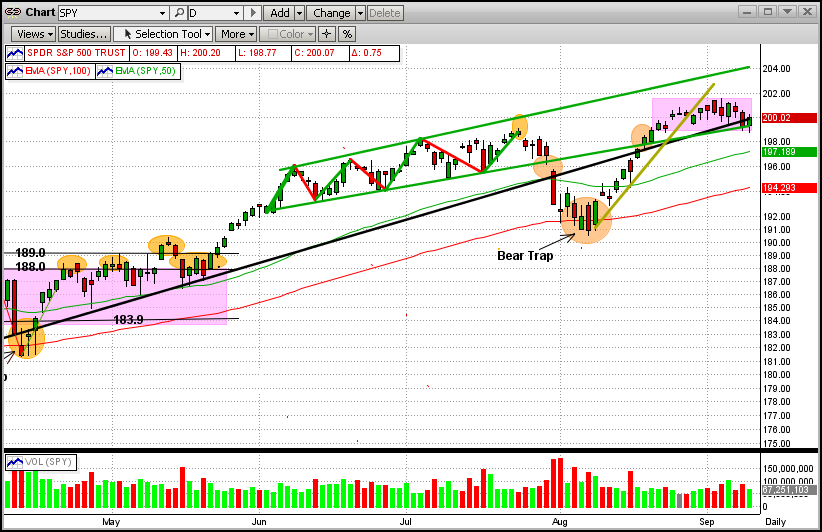
It is interesting that the majority of the times that a market goes into a sideways pattern, it breaks out the way that it went in (like now, the SPY entered the sideways trading pattern going up, so we expect it to break out to the upside). After that, the next upside goal is to break the upper trendline in the green up-channel trading range. On the downside, the SPY has support at both the 50-day EMA and the 100-day EMA (the latter of which lies about 3% below today's close).
The odds are for the uptrend to continue (the MIPS models all remain long at this time). We all know that this can change at any time and believe that MIPS will get us out when it does. So, sleep well.


