Lots of action this week. Of course, Yellen is still doing everything she can to help the fat kats to get fatter. She claims that her efforts to drive interest rates to near zero are to boost the economy and to help the little guys, but we all know better than to buy that. If the Fed really wanted to help the little guys, it could have simply given each family in our country over $55,000 each (not practical, but we did print that much new money).
So, where did the money go? Of course, quantitative easing has helped the economy and the little guys some, but the real benefactors have been the top 1% who have funneled money to themselves en masse by borrowing hundreds of billions of $'s at near zero interest and "raking it in" with things like huge gains in higher-and-higher stock prices. For example, the process has been to:
(a) borrow at near zero interest,
(b) buy back company stock,
(c) profits/share go up because the number of shares go down, NOT because profits go up,
(d) stock prices go up both from the higher buying volume and the "higher" profits/share ratio,
(e) fat kats make big money on the higher stock prices of their personal shares, and
(f) fat kats get huge bonuses because "they" increased the profits/share.
And, there is still tons of money out there that has not yet found its way into the economy.
If will be very difficult for the stock market to collapse while this process continues and when there is really no other competitive place to invest big money with high liquidity.
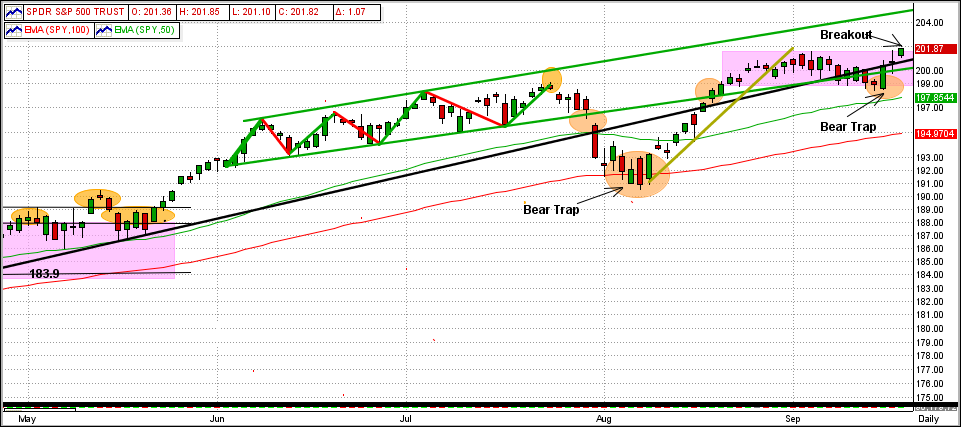
See the graph immediately below:
What you see is the tail-end of a 19-month uptrend (black line), a breakout today to the upside from within a 3-week sideways trading pattern (pink rectangle), and a new high on the SPY at $201.70/share. Upside resistance is at the upper end of the green trading range, and downside support is at the 50-day EMA.
During this 19-month trend period, the number of MIPS3 trades has been very low due to the strong market uptrend (MIPS does not trade just to trade). The MIPS3/MF model usually trades 10-15 times/year, but it has only traded about 6 times since the end of 2012. More trades in a market like this usually result in getting whipsawed (as many other timing models have experienced).
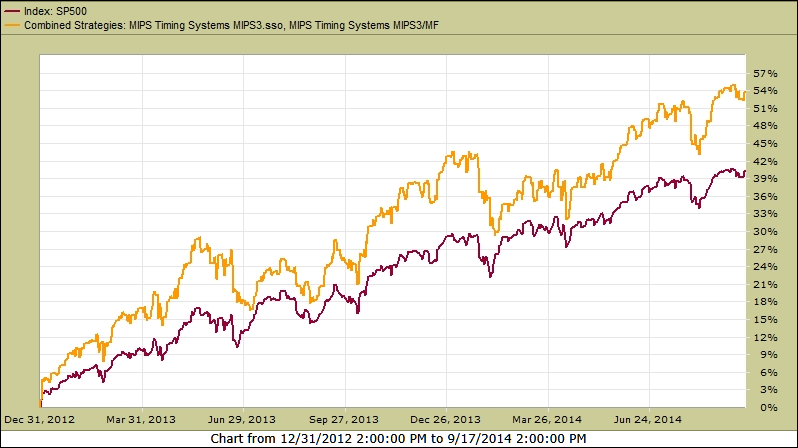
So, how did MIPS3/MF perform during this time frame ???
See the graph of MIPS3 below trading 1/2 each of SPY and SSO on Long signals (1.5x leverage) and 100% SH on Short signals (no leverage). During this time, MIPS3 was up +54% !!!