We are pleased to report that we had a large number of respondents to our recent "Survey" email (see Survey email below). Most were very passionate and confident about their vote. And, many of our MIPS members are seasoned investors and/or professional money managers.
Rounding off to the nearest 5%, the final vote was:
UP DOWN Don't Know
65% 30% 5%
Thanks for your inputs...
- and remember, no matter what we think, we do not personally have to be right to make money in the market
- we just need to follow MIPS !!!
Feel free to contact me with questions (10am-8pm CDT, 6 days/week)
Paul Distefano
===============================================================================


     <<< "Survey" email from 9/19/2014 >>>
          MIPS - Survey: S&P500 3000 or 1000 ???
MIPS Members:
Of course, it is possible that this market will continue up at least until the S&P 500 reaches 3000. On the other hand, it is just as likely that the S&P 500 will collapse all the way down to 1000 or lower.
This market is similar to the market in 1995, where the Nasdaq had risen 10-fold in the prior years from 1985. In 1995, everyone was crying bubble, bubble, bubble and the Fed Chairman Greenspan coined the phrase "Irrational Exuberance" (meaning 100% emotional behavior). So, where did the market go from there? It continue up 6-fold from 750 to over 4500 in the next five years !!! [See our previous email below from May 11, 2013 entitled " History Repeats Itself, Like 1995 or 2000?"].
As one would expect, after the Nasdaq reached 5000 in the year 2000, the Nasdaq crashed big-time (65% drop) !!!
VOTE Up or Down in your email response
So, we would like your opinion as to whether we are:
1) in a market like 1995 where the market is going to continue up at least another 50% (to
a S&P 500 of at least 3000) or
2) in a market like 2000 where the market is going to crash at least 50% (to S&P 1000) ???
Thanks
Paul Distefano
=================================================================================
Saturday, 11 May 2013
As with almost everything in this world, the behavior of the stock market is made up of actions from millions of people. And, as with almost everything in this world, the stock market does kind of repeat itself. The $64,000 question is what is repeating and when?
This week I saw a talking head on CNBC discussing what was going on in the market and why, and if the current 5-year bull market would continue. Like most others, he gave a very nondescript answer. His short answer (and my interpretation of his answer) was that the action of the stock market would follow one of the options below:
1) Rational Exuberance - 60% (that is, keep going up as it should)
2) Irrational Exuberance - 30% (that is, going up faster, even though it should not)
3) Market Crash - 10% (that is, a complete reversal from today's bull market action).
This reminds me of three market behaviors of the Nasdaq in the 1990's (when Alan Greenspan coined the term "Irrational Exuberance").
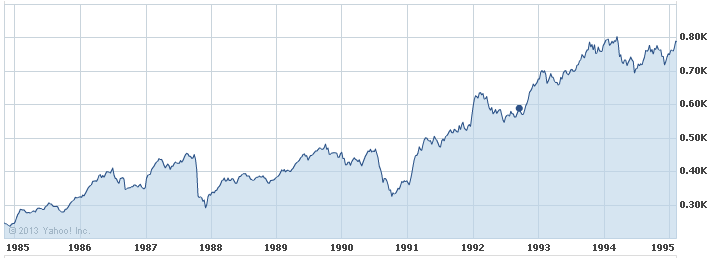
Graph 1 - Rational Exuberance
This graph shows the Nasdaq from 1985-1995, when the index TRIPLED, but did so because technology was booming. This fits "Rational Exuberance" because everyone was happily making money on the high growth of companies like Microsoft, Oracle, Cisco, etc. In this 10-year period, the Nasdaq rose in value from about 250 to 775, ending with "overbought" conditions, nose-bleed P/E ratios (Cisco had a P/E ratio of over 100), etc. Then, the pundits were were crying, GET OUT!!!
Were they right?

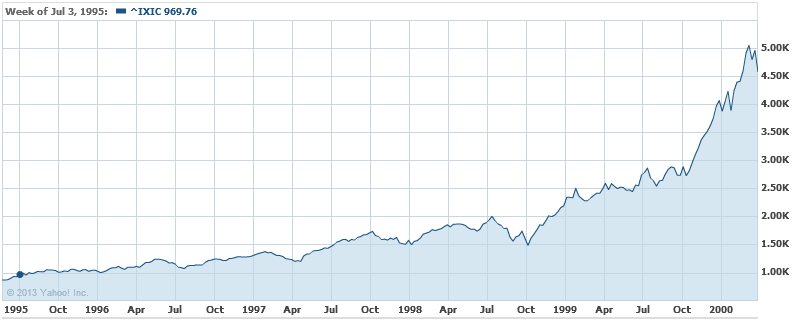
Graph 2 - Irrational Exuberance
Of course, the pundits were right about the fundamentals, but DEAD WRONG about the Nasdaq market performance
- the proof lies in the following 5 years performance [that is, in the time period of 1995-2999 (Graph 2)]
- this is when everyone (especially the little guys) went into panic buying ("Irrational Exuberance")
- the net result over this 5-year period was that the Nasdaq WENT UP OVER SIX-FOLD, from 775 to 5000, with
crazy things like Cisco's P/E ratio growing to over 400, Yahoo's market cap being more than the GDP of Iceland, etc.
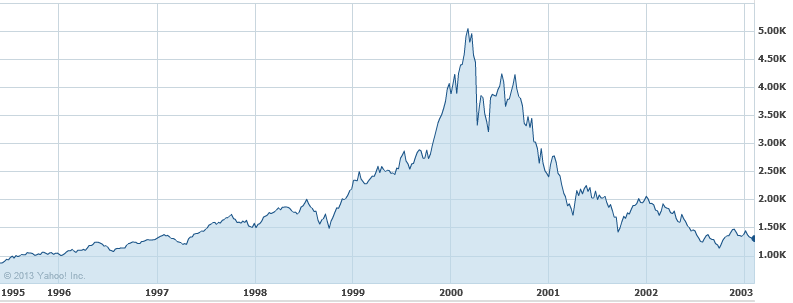
Graph 3 - Market Crash
We all know that US stock market indices went up in smoke after the year 2000, but getting out in 1995 was way too early.
OUR POINT IS THAT SINCE THE MARKET DID RECENTLY BREAK TO THE UPSIDE AND SET NEW ALL-TIME HIGHS, AND IF THE BIG GUYS GET THEIR WAY, THE LITTLE GUYS CAN PUSH THIS MARKET WAY HIGHER THAN IT SHOULD GO (like 1995-2000), AND THEN THE BIG GUYS WILL DUMP BIG-TIME (like 2000).
BUT, IF THE LITTLE GUYS ARE NOT ABLE TO KEEP THE SPY ABOVE ITS CURRENT RESISTANCE LEVELS, THE BIG GUYS WILL MOST LIKELY SELL DOWN. OF COURSE, THIS CAN RESULT IN (1) A RELATIVELY SMALL DIP WITH A CONTINUED UPTREND, OR (2) A BIG MARKET CRASH (like 2000).
We certainly can't predict what will happen from here, and that is why we developed and follow the MIPS models. If and when this market makes a major change, MIPS will most likely miss a minor part of the change, but will find and follow the resulting trend. And, MIPS should ignore minor changes to prevent getting whipsawed.


