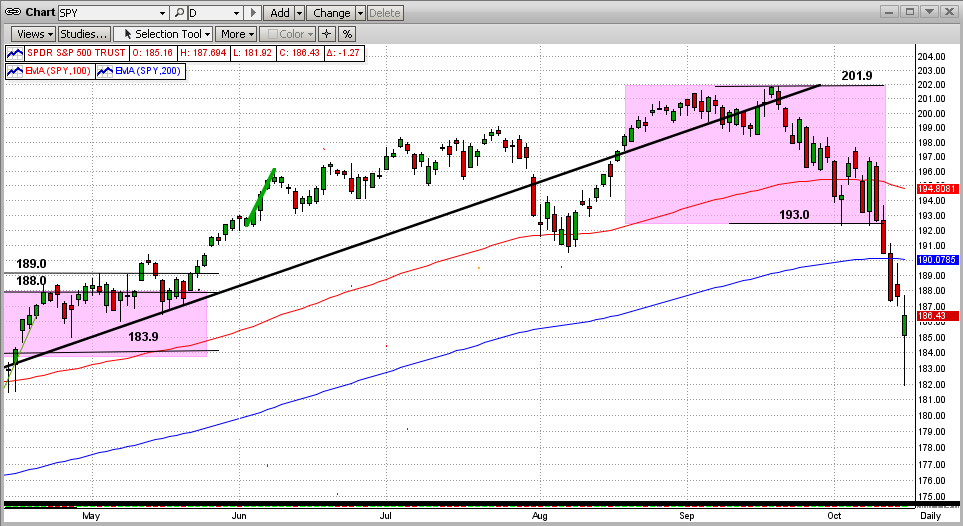
The short-term view of the market looks terrible and simply could not look much worse. In the last 3 weeks the SPY has fallen about 9% from its all-time high of $201.9, broke through the bottom of its most recent trading pattern, broke through both the 100-day and 200-day EMAs, etc. Like I said, couldn't be much worse. One good note yesterday (Wednesday) was that the price action in the 2nd half of the day could represent a "One Day Key Reversal" pattern, which usually identifies a short-term rebound.
Should we be worried?
Remember, we are intermediate-term investors and not day traders. After the strong ride we have had in the stock market in the last 3-5 years, a short-term drop does not usually cause MIPS to signal a directional change in the stock market. [In other market conditions where the intermediate-term trend had only gained say 10-15%, a dip as small as 2-3% would catch MIPS' attention.] In other words, all changes in the price movement of the SPY are looked at by MIPS on a "relative" basis. For example, a 3% drop in a market that has been up 10% represents a 30% setback, whereas an 9% drop in a market that has been up 50% represents only an 18% setback. And, a market that grows 50% will recover a 9% setback quickly.
Long-Term View
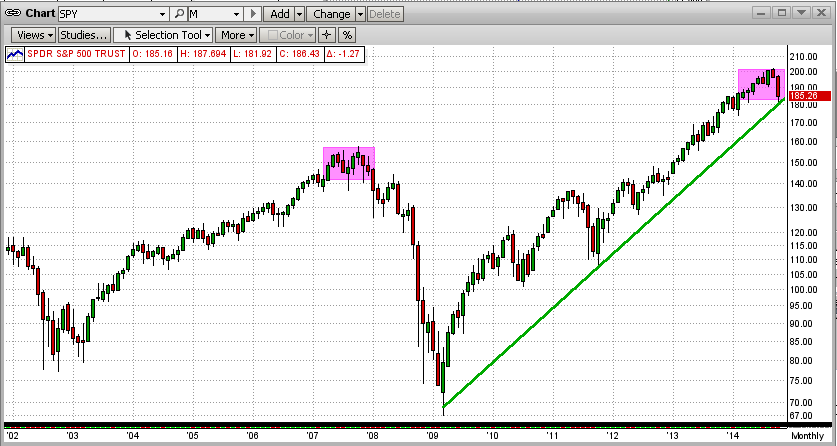
There is one thing that investors need to concentrate on to become successful long-term investors. They must be able to somewhat ignore short-term (daily) gyrations in the market and put more emphasis on the long-term view. Looking at the monthly chart below, we can see that the disaster on the daily chart above is hardly noticeable on a monthly chart.
Topping Process
- Is the market topping?
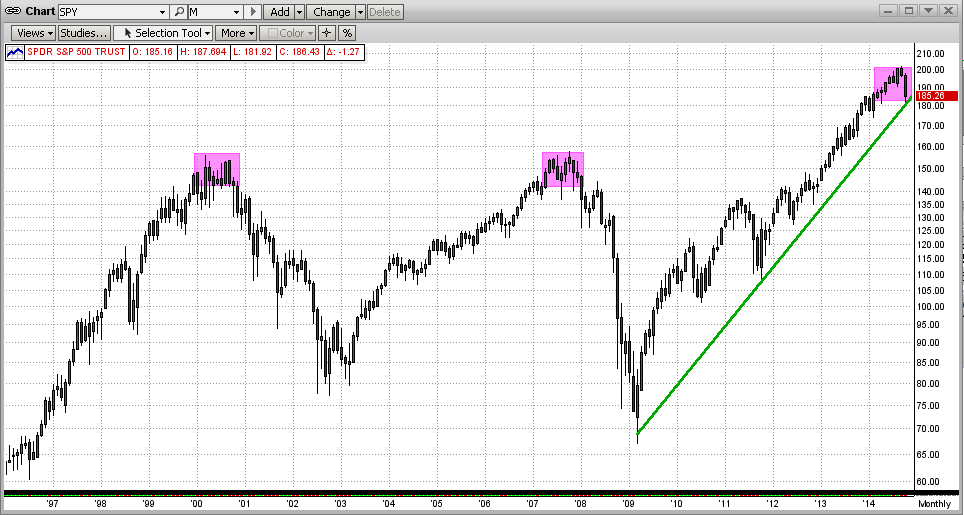
The good news is that strong bull markets (4-6 years up) do not turn around easily or quickly. For this, let's look at the two most recent market "crashes", one in 2000 and the other in 2008. From the graph below, we can see that it took 8-10 months for these bull markets to give up and collapse. At this time, we are about 1/2 of the way through this process. Of course, the market in October could be the catalyst for the "Big One".
Our Goal
Our goal in MIPS is to capitalize on at least 80% of each major market crash. We do this by being willing to give up 10% on each end of the cycle to make sure that we capitalize on the other 80%).
What if this is the beginning of the "Big One" ?
For that, we have to rely on MIPS. All of the MIPS models are now on the edge of going short, but they have not yet issued new short "Signals". Sometimes that is a blessing.
The MIPS models have been around since 2004, and the MIPS3/MF signals have been tracked by TimerTrac.com since 11/04/2005. During that time, we have had several intermediate-term downtrends and MIPS has profited from most of them (of course, MIPS also beats the SPY in up markets by detecting and shorting these intermediate-term downtrends).
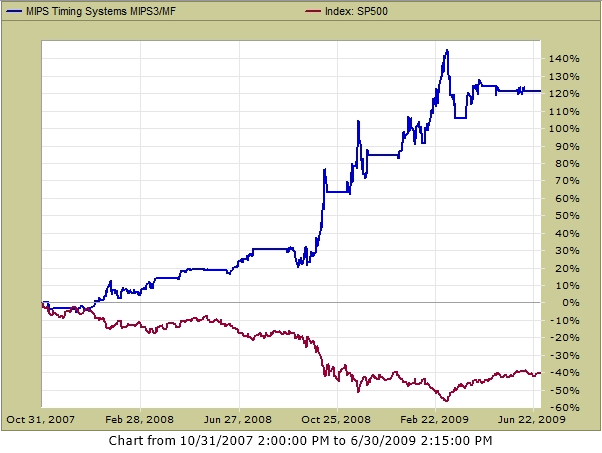
We have had only one really big stock market "crash" in this 9-year timeframe from 2005 and that was from 4Q'07-2Q'09, when the S&P 500 dropped by over 50%. How did MIPS do in that market? For that, see the graph below for the period of the last big market crash using verified MIPS3/MF signals from TimerTrac.com.
MIPS3/MF +120% SPY -40%