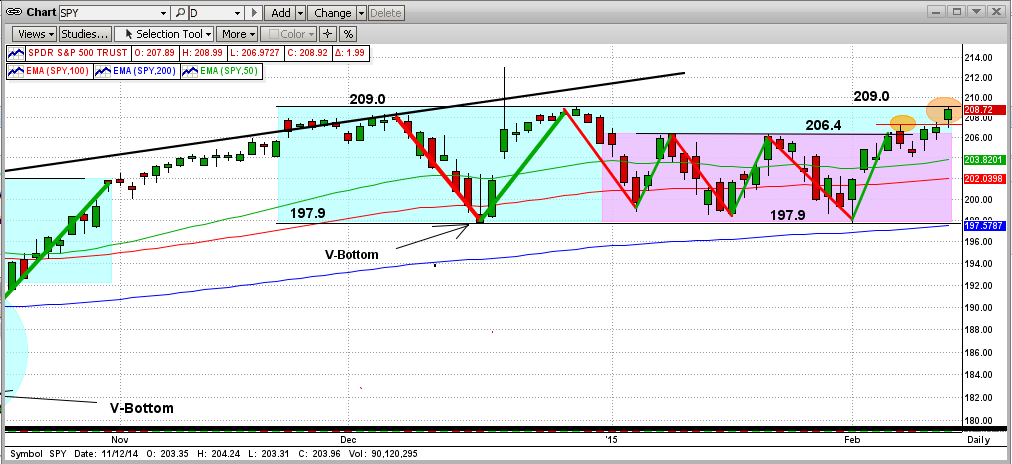
In our previous blog, we talked about a stalemate at the wall of the Bear's castle (SPY resistance at $209), just over the "moat" in No Man's Land (see 2nd graph below from previous blog). This was the 5th time that the Bulls had advanced up toward the Bears' front line, after having been beaten back in the previous 4 attempts.
But, four days ago (2/13/15), the Bulls prevailed and the SPY broke $209 to the upside. At that time, we said the Bulls needed to show some strength and "staying power" by: (1) trading above $209 for at least a few days, and then (2) making a dramatic "power move" up soon thereafter. Well, today the Bulls did both (see the graph immediately below). [Look how similar the breakout immediately below is to the breakout from the last sideways trading pattern in May'14, as shown in the 3rd graph below.]
This seems to indicate a move higher from here. All of the MIPS models are (and have been) long, and we expect them to remain that way. OOOppppsss, here I go again... predicting what MIPS will do. Much better to wait for MIPS to tell us what to do. Stay tuned !!!
<<< Previous Blogs >>>
MIPS Members:
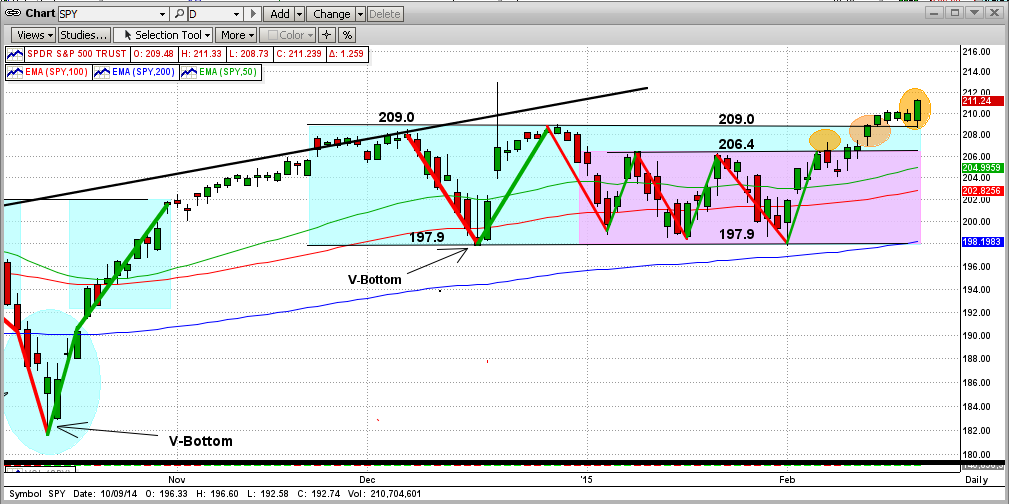
From the graph immediately below at today's close, you will see that the advancing forces (the Bulls) made their way up across the battlefield (pink space) from 197.9 to the beginning of No-man's-Land at 206.4, with little or no resistance.
Then, they carried on through the "moat" around the castle (blue space) in No-Man's-Land in short order, with few set-backs. But, the Bears "stalled" them at the castle wall today, right at the 209.0 level (see the right-most orange circle in the graph). BTW, the 209.0 resistance level is the SPY's all-time-high, and hence, could provide ultra-resistance.
The last time the market charged the castle's wall, the upside resistance was at 189.0 (2nd graph below). It took nine charges to break out of No Man's Land, and it did so to the upside.
In order for the Bulls to feel comfortable now, any break to the upside from here needs to be dramatic. Otherwise, we may experience a Bear provided trip back down to 197.9, or lower (no free ride).
Let's keep watching, but let's wait for MIPS to tell us what to do next !!!
- Stay tuned...
================================
<<< Previous Blog >>>
MIPS Members:
Re: Please glance at the two links below
1) http://mipstiming.com/blog/view/7781/the_market_battle_in__no_man_s_land___2014
2) http://mipstiming.com/blog/view/7848/_the_market_battle_in__no_man_s_land___2014____bulls_win_
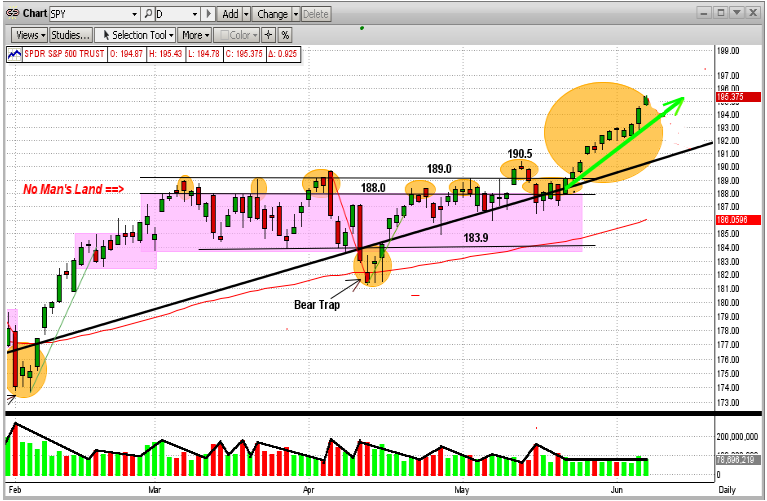
Most of you are familiar with flat/sideways patterns that develop into what I call "No Man's Land". No Man's Land is a piece of the graph where the price (say of the SPY) gets very close to a resistance level (to the upside from below) or support level (to the downside from above) and repeatedly fails to break above resistance levels or below support levels. The market can "play" in No Man's Land for months.
Ultimately, the market (SPY) breaks out of No Man's Land above or below, and makes a significant move in the direction in which it broke out of the sideways pattern. The last time this happened is shown in the graph below. It shows the cyclic price action of the SPY between Mar-May 2014 and the breakout in late May'14. You will see that "the breakout" did not happen until the 7th attempt by the SPY to break to the upside. (Lots of dead bodies and broke traders that trade in these sideways trading patterns.)
Hope this helps !!!


